Can We Use “Big Data” To Add Precision and Make Management Decisions in Cranberry?
Small-scale replicated field plot research is very useful to explore and identify potential new technologies and practices that can improve cranberry production. But there’s also much to be learned from what growers are currently doing and tremendous power in the volumes of data already collected on marshes over the seasons. The goal of this article isn’t to change how growers manage cranberries; it’s to raise awareness of the potential to use a “big data” approach to optimize cranberry production and to get guidance on whether the questions that we ask here are important to the industry.
Many questions can be asked when diving into a robust data set. In this primer on the topic we report on a very preliminary look into data on 41 production variables from over 500 Wisconsin cranberry beds, and ask three questions:
- What inherent bed characteristics and production decisions have the greatest impact on cranberry yield?
- In general, what are the most common management decisions?
- Is there a yield advantage to intense management and conversely a yield penalty to managing less intensely or using fewer inputs?
What inherent bed characteristics and production decisions have the greatest impact on cranberry yield? To explore this question, we used some complex machine learning and regression analyses to determine which of the 41 variables contribute to or take away from cranberry yield. We’ve grouped these variables into three general categories: inherent characteristics related to the physical location or climate that are not easily managed (ie. water pH), variables that can be managed by the grower but are long-term investments that don’t happen in a single season (ie. renovation/variety change), and variables that can be managed by the grower during a single season (ie. nitrogen application number and rate). A few variables certainly cross over categories, such as ice thickness that’s determined by winter weather and grower flood-making decisions but are assigned to a category here for the simplicity of discussion.
Here are examples of the variables and their relative influence on cranberry yield from a data set of over 500 cranberry beds in a single season:
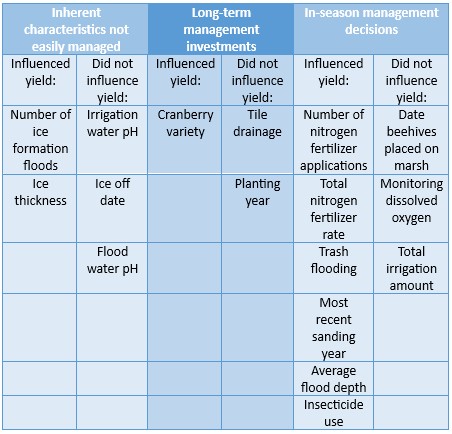
By far, the greatest influence on yield was the cranberry variety, where it’s common knowledge that the newer introductions far outyield older varieties. As for variables that can be managed by the grower, insecticide use had a strong positive effect on yield, suggesting heavy insect pressure in this particular season. Increasing the number of fertilizer split applications was also related to increased yield, more so than season total nitrogen rate. Each split in nitrogen fertilizer application was related to a 6.8 barrel per acre increase in yield. Interestingly, sanding year was also highly related to cranberry yield, where each year out from the most recent sanding decreased yield by about 5 barrels per acre.
In general, what are the most common management decisions? Growers are inherently curious about what they’re neighbors are doing and often ask about the most common practices, like how much Callisto do most people apply per season, how much nitrogen do they apply or what frost set point temperature are they using? While all marshes differ in many ways, it’s a useful exercise for growers to know how they’re operating compared to the rest of the industry, and then, if they are managing differently, asking if it’s for the better or not (that’s the next question!). Here are a few examples of mean or average management, as well as the middle 50% of what the industry is doing. In this case, the data used is for bearing ‘Stevens’ beds only to reduce confounding factors given that variety is such a large yield driver.
| Variable | Average | Middle 50% range |
| Total N rate (lb/A/season) | 52 | 33 to 62 |
| Number of N applications | 4.5 | 3 to 6 |
| Total P rate (lb/A/season) | 43 | 28 to 48 |
| Total K rate (lb/A/season) | 120 | 84 to 180 |
| Number of pesticide applications | 3 | 2 to 5 |
| Number of floods to make ice | 4 | 2 to 8 |
| Maximum ice depth | 11.5 | 10 to 12 |
| Years since last sanding | 2.3 | 1 to 3 |
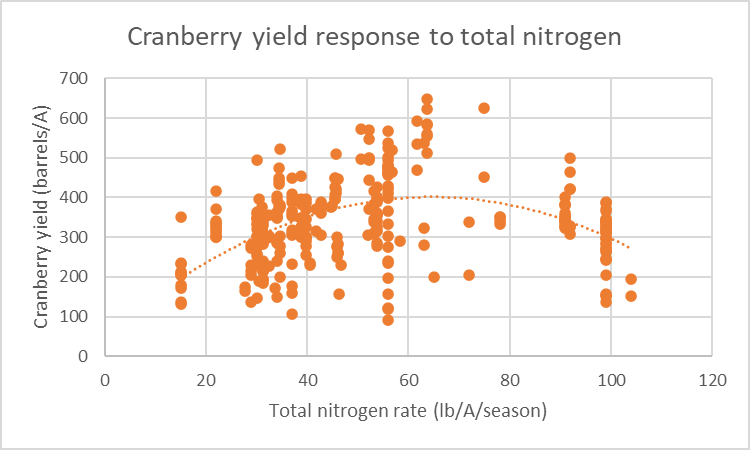
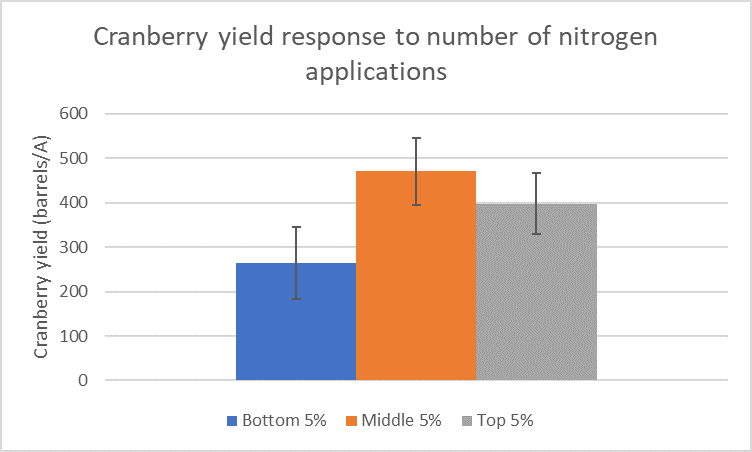
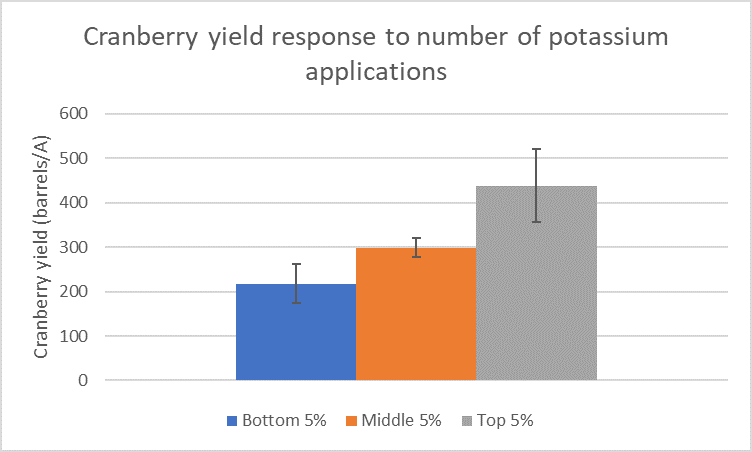
Is there a yield advantage to intense management and conversely a yield penalty to managing less intensely or using fewer inputs? Advances in agricultural practices, variety genetics and technology have driven substantial increases in crop yield and quality. But does it pay to be leading the pack in making changes on the marsh, is the “sweet spot” to be in the middle of the pack and is there a penalty to being the last to alter production? When it comes to inputs like fertilizer and pesticides, is “more” always better or is the optimum not always the maximum? From the researchers’ standpoint, the impact of our work is only as good as the industry adoption of it, but what drives behavioral change? Here, we explored those questions and relationships with a few key variables that were identified in the first question analysis as influential to cranberry yield. Let’s contrast nitrogen and potassium nutrient management as an example. We’ve long known that the maximum is not the optimum when it comes to nitrogen, and that’s very nicely demonstrated in this data set where in figure 1 we see a very typical response curve and the yield penalty when excessive nitrogen pushes cranberry vines toward vegetative instead of reproductive growth. When it comes to the number of nitrogen applications during the season, there appears to be a yield penalty when too few passes over the bed are made, but not a benefit beyond the middle of the pack to be the most intense adopter of split applications (figure 2). In contrast, when the number of potassium applications are considered, there’s quite a stark advantage to making more split applications (figure 3).
This is just a preliminary snapshot with much still to be developed and refined in the analyses to deal with confounding factors and endogeneity (where one variable changes in response to another, but not in a causal way). Again, the goal here is to stimulate discussion and gauge interest in whether complementing field research data with analyses of robust grower data is an area of industry interest. And keep in mind the work here is only from 41 variables and just over 500 cranberry beds. The variability in the work here can be greatly reduced, homing in on a finer point and more confident conclusions, with larger data sets over multiple growing seasons. If we assume an average bed size of 3 acres and 20,600 acres in Wisconsin, this data set could include over 6,800 beds per season.
This article was posted in Cranberry and tagged Cranberries, Jed Colquhoun, Paul Mitchell.