Easy Online Resources to Help Anticipate and Understand High Precipitation Weather Events
I’ll be the first to admit that I’m a bit of a weather geek, and as such was quite intrigued by Dr. Shane Hubbard’s presentation at this year’s Cranberry School. In particular, I followed up with Dr. Hubbard to learn more about the current ability to forecast high precipitation weather events that affect cranberry production in several ways, such as:
- Cranberry growers are also hydrologists and spend a lot of time managing soil moisture to optimize vine health and berry production, but a heavy rainfall throws a wrench in that process.
- Unanticipated high rainfall events can also impact the utility and risk related to fertilizer and pesticide crop inputs. Heavy rainfall can not only dilute or reduce the efficiency of residual crop inputs such as fertilizer and herbicides, but also pose environmental risk from leaching, runoff or flooding.
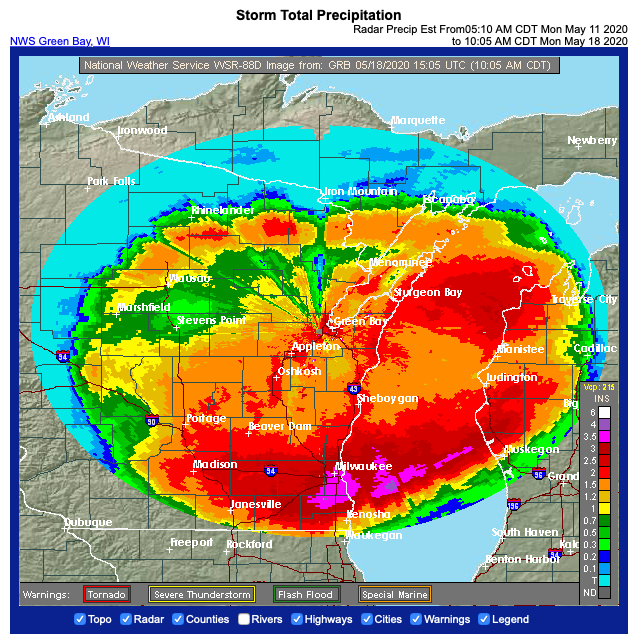
- These events have been more common lately. For example, from May 1 to October 31, 2019 the Hancock Agricultural Research Station recorded 11 days with precipitation between a half and one inch and 8 days with over one inch. This past weekend was a stark example, where areas surrounding cranberry country have reports of flooded streets and wet basements. The National Weather Service storm total precipitation map looks like an unwelcome rainbow (source: radar.weather.gov):
Dr. Hubbard points out that extreme precipitation events with record rainfall amounts are still difficult to forecast, particularly when related to thunderstorms common in summer months. We’ve all had that experience where the wipers can’t keep up and a mile later the road is dry. With that said, he pointed me toward some online forecasting resources that I’ve found worth bookmarking to get a sense of what’s potentially coming in the next few days. I’ve shared these with a few growers and they’ve found them interesting and useful in planning crop management activities. There are two National Weather Service sites that I’ve found particularly useful:
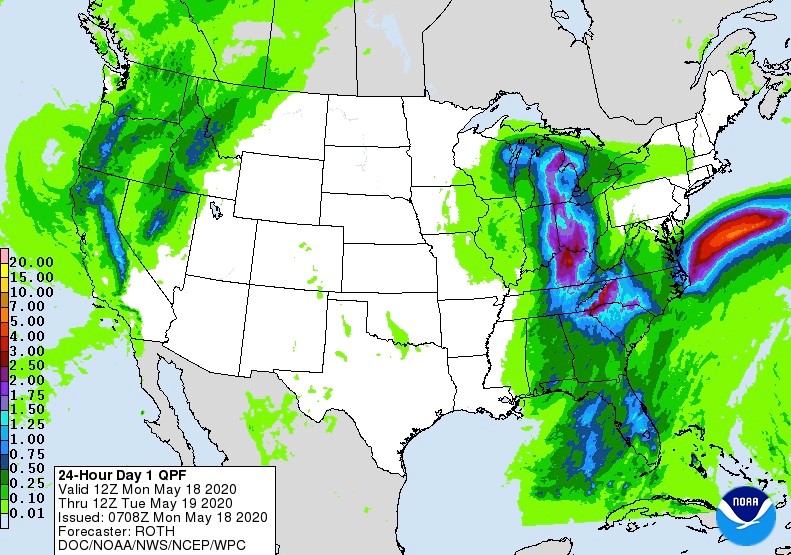
- The Weather Prediction Center’s precipitation forecast maps: https://www.wpc.ncep.noaa.gov/qpf/qpf2.shtml. Here’s an example from that site of what the map shows for precipitation forecasts as the system shown in the storm totals image above moves across the lake to Michigan.
- The Weather Prediction Center also has a very useful site that puts a probability on rainfall amounts, and the user can select both the rainfall amount and forecast timeframe: https://www.wpc.ncep.noaa.gov/pqpf/conus_hpc_pqpf.php. I find myself checking this site most often as we plan our field activities across the state.
As Mark Twain said, “climate is what we expect, weather is what we get”. While that’s still true, I hope that you also find these refined resources useful in thinking about your crop management activities.
This article was posted in Cranberry and tagged CCMJ, Cranberries, precipitation, weather.