Grape Fruit Quality Assessments
Harvest day is perhaps the most important day of the year for grape grower. It is the last major task of the growing season, but it also defines the quality of the wine that will be made out of the grapes. Every year growers have to face the dilemma of either delaying harvest until the fruit has achieved the desired quality standards or harvest in a hurry before fruit is overripe and berries may shatter off the clusters. Fortunately, we do have some parameters that can help us define ripeness levels, such as soluble sugar concentration (ºBrix), titratable acidity (TA), and pH. In addition, color, flavor, and aroma of the fruit are important characteristics to evaluate fruit ripeness.
Although no single factor or equation can provide an answer of when to harvest for every grower, the routine standards mentioned above can provide a general rubric for establishing potential harvest dates. Here in Wisconsin this past summer, we tracked ºBrix and TA for four red wine and two white wine cultivars, at the West Madison Agricultural Station (WMARS), near Madison, and at the Peninsular Agricultural Station (PARS), in Door County. The graphs on the left side present data for WMARS, and the ones to the right side for PARS. Each graph also illustrates, in a grey line, growing degree day accumulation during the growing season for each station.
Sugar (brix) accumulation for four red wine varieties at the West Madison Agricultural Research Station (colored lines), compared degree day accumulation (grey line). 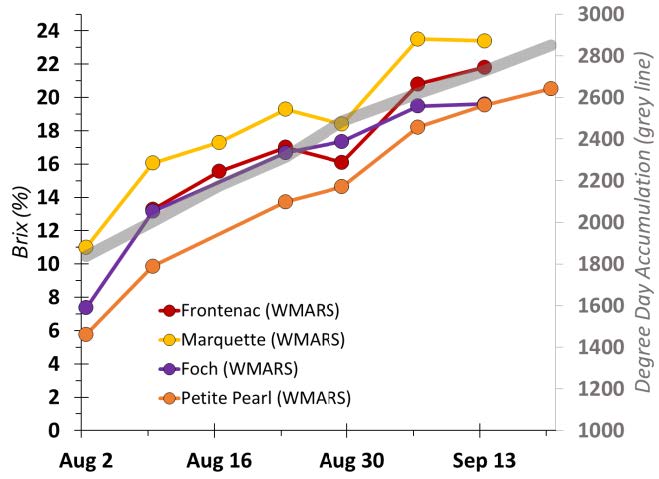
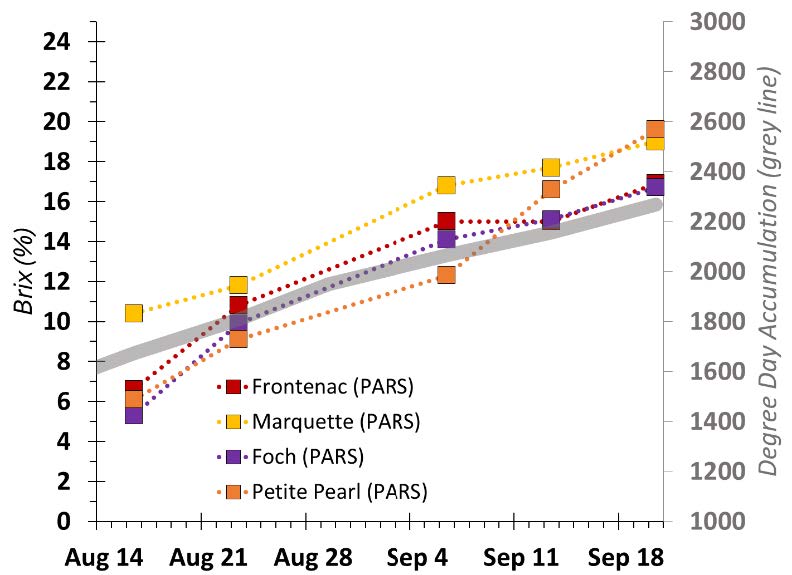
Sugar (brix) accumulation for four red wine varieties at the Peninsular Agricultural Research Station (dotted colored lines), compared degree day accumulation (grey line). 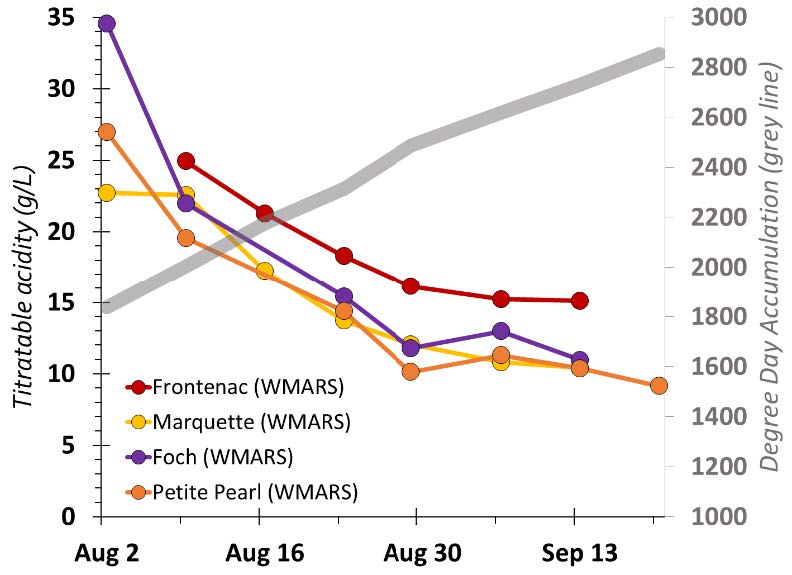
Acidity (TA) accumulation for four red wine varieties at the West Madison Agricultural Research Station (colored lines), compared degree day accumulation (grey line). 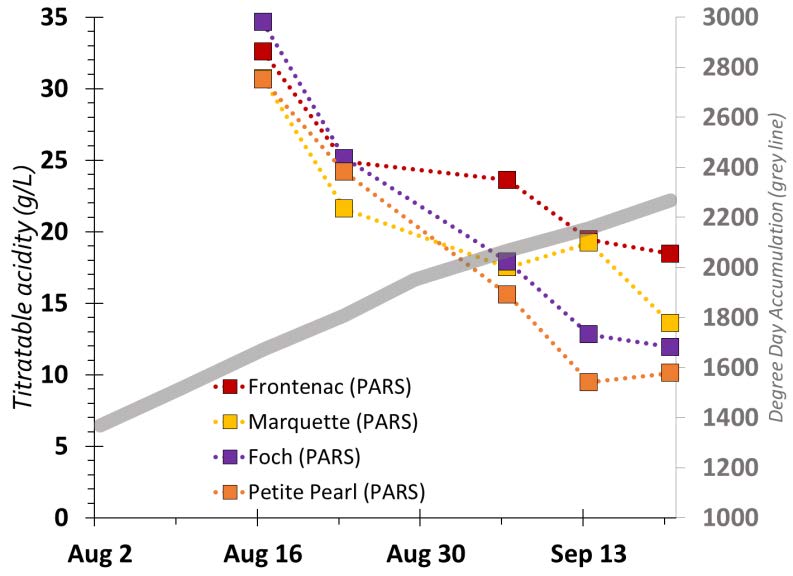
Acidity (TA) accumulation for four red wine varieties at the Peninsular Agricultural Research Station (colored lines), compared degree day accumulation (grey line). 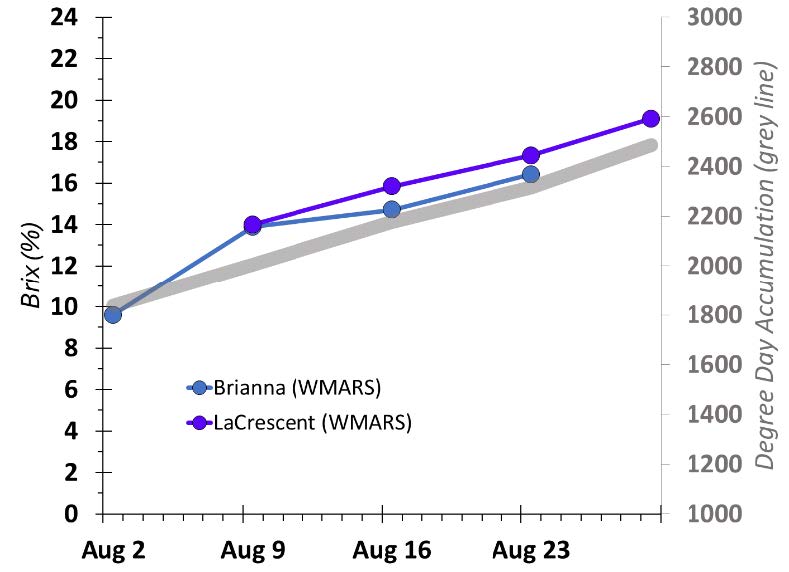
Sugar (Brix) accumulation for two white wine varieties at the West Madison Agricultural Research Station (colored lines), compared degree day accumulation (grey line). 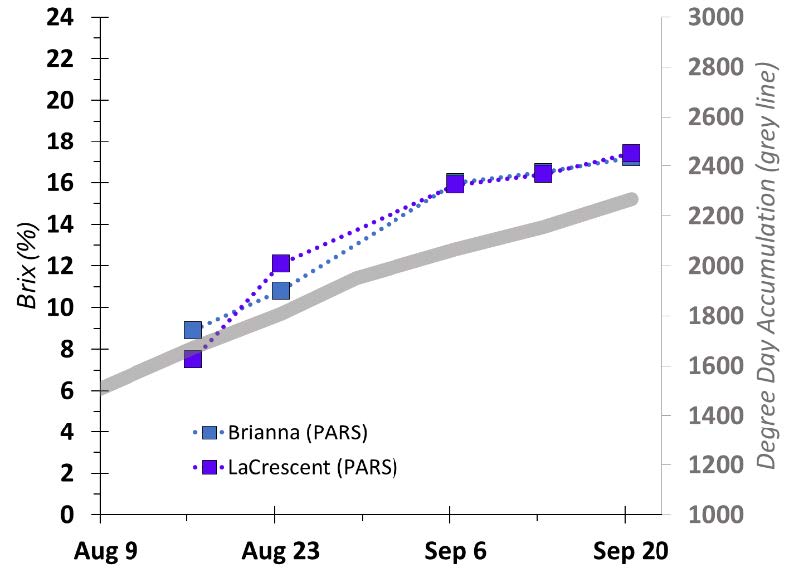
Acidity (TA) accumulation for two white wine varieties at the West Madison Agricultural Research Station (colored lines), compared degree day accumulation (grey line). 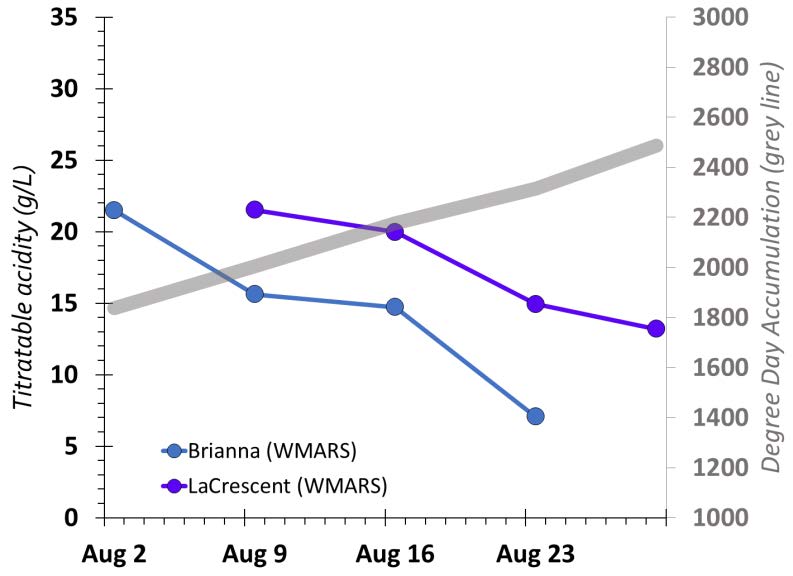
Sugar (Brix) accumulation for two white wine varieties at the Peninsular Agricultural Research Station (colored lines), compared degree day accumulation (grey line). 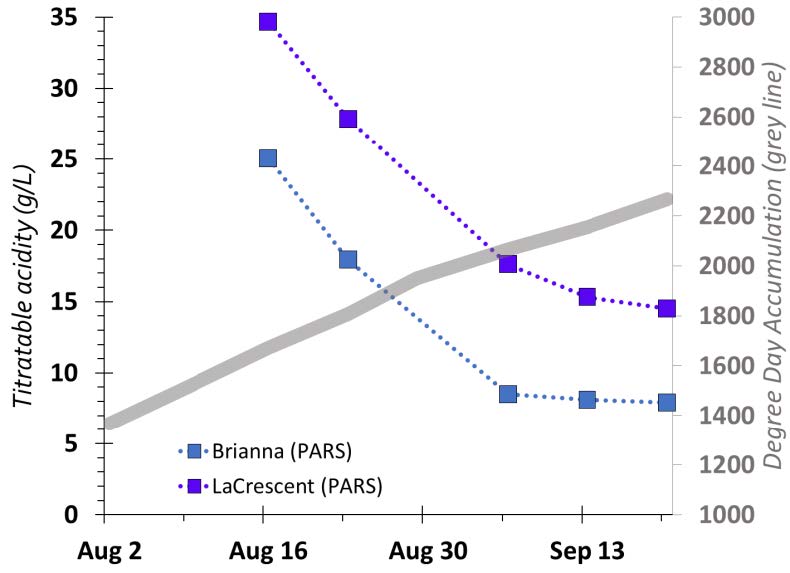
Acidity (TA) accumulation for two white wine varieties at the Peninsular Agricultural Research Station (colored lines), compared degree day accumulation (grey line).
The graphs clearly illustrate the correlation between growing degree days and grape maturity, with ºBrix and TA tending to level out around 2600-2700 degree days at WMARS (at PARS grapes were harvested before we reached 2500 degree days).
This article was posted in Grapes and tagged Amaya Atucha, Annie Deutsch, fruit quality, grape fruit quality, Grapes, Janet van Zoeren, Madeline Wimmer.