Growth of Vegetation and Growth of Berries
As I work to understand the current state of cranberry research, the UW-Madison research faculty often helpfully point me to important research that has stood the test of time. “If we can see farther, it is because we stand on the shoulders of giants,” as the saying goes, and it seems fitting to revisit past work from time to time. This article is a brief recap of Hawker & Stang’s 1985 paper “Characterizing Vegetative Growth and Fruit Development in Cranberry By Thermal Summation.” They study older cultivars (Searles and Ben Lear), and while the specific numbers they arrive at should not be extrapolated to new cultivars, the general patterns of growth can be.
Stang and Hawker used a plant growing degree day (GDD) accumulation to chart shoot length, berry length, shoot weight, and berry weight. The plant GDD model they used calculated growing degree-days between 48.2° Fahrenheit and 89.6° Fahrenheit. They also tracked ethylene evolution and anthocyanin production, but did not find them to correlate with the chosen GDDs well.
Growers from three locations provided Searles shoots and berries throughout the 1982 growing season. Two locations (central, westcentral) were at 44° latitude, and one (northern) was at 45° 30`.
Figure 1 shows the progression of plant GDDs across the 1982 growing season in the three locations. In general, a trend exists that while northern latitudes accumulate GDDs more slowly early in the spring, the longer day length in mid summer allows sufficient accumulation for fruit production. This data set in particular does not show that trend dramatically, so I wanted to mention it so you can watch for it in other years.
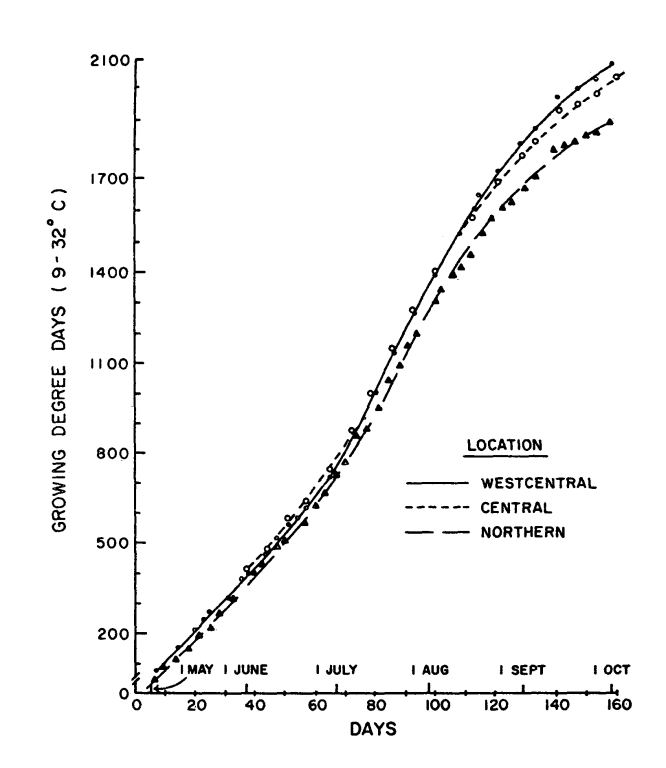
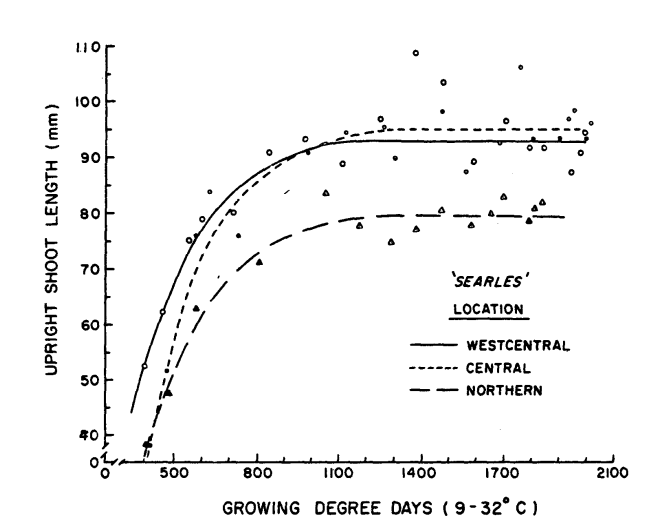
Figure 2 shows the length of upright shoots tracked across the plant GDD regime. The paper doesn’t specifically mention whether this is a mix of fruiting uprights and vegetative uprights, or whether only fruiting uprights were sampled. Hawker & Stang do mention that berry number per upright was measured, so at least some of the uprights were fruiting. You can see that by (roughly) 1000 plant GDDs, which was (roughly) mid-July in 1982, upright growth plateaued. We do see the observation points following the trend curve more closely early in the season, and after the plateau we see some observation points outlying from the overall trend. Perhaps these outliers were non-fruiting uprights, or perhaps they occurred where excess nitrogen was available (either from application, or from the natural production of N by organic matter on warm days).
While the height of the upright shoots plateaued after ~1000 GDDs, shoot dry weight only briefly plateaued as fruit set was beginning. After fruit set, dry weights continued to increase. The paper does not mention whether this was a result of leaves increasing in size, stem increasing in diameter, or a combination of both.
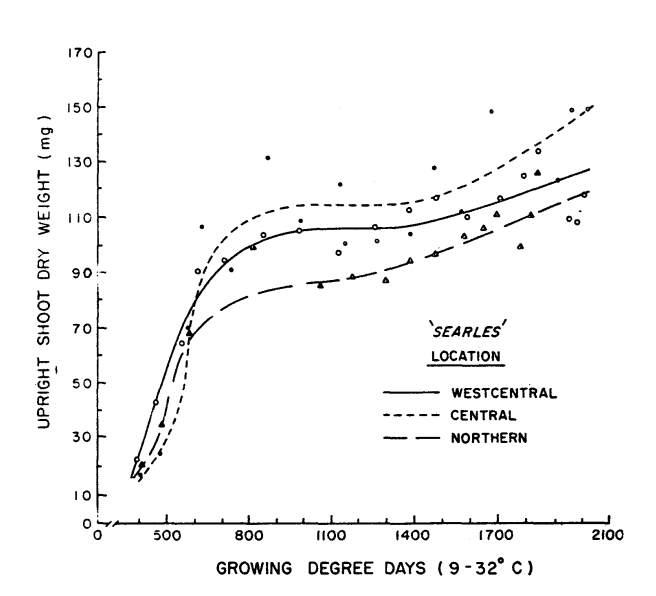
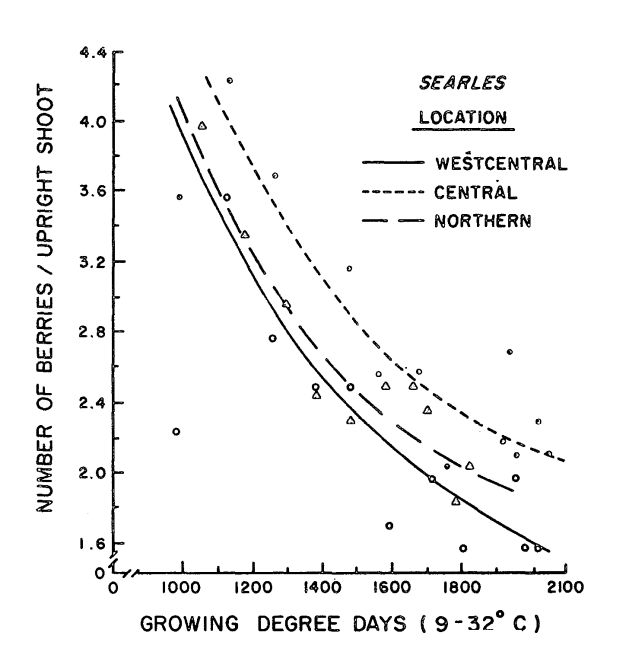
Figure 4 shows the number of fruit per upright throughout the growing season. This is a chart where the difference between Searles (where an upright would convert 4-7 flowers to 1-3 finished berries) and modern cultivars is large. Still, I’m including this chart to highlight the fact that the cranberry plant continues to abort fruit throughout the growing season (in contrast with most other fruiting plants). Hawker and Stang did not determine whether fruit abortion was caused by inadequate pollination, competition among berries, or other reasons—but it was observed in all three locations.
Hawker and Stang discuss berry length and weight, and explore correlations between ethylene (a hormone that cues fruit ripening) and anthocyanin. The paradigms for color (TAcY for juice production, vs machine vision for sweetened dried cranberry production) have shifted since 1985, so if there is grower interest I will recap the color portions of this paper in a future CCMJ.
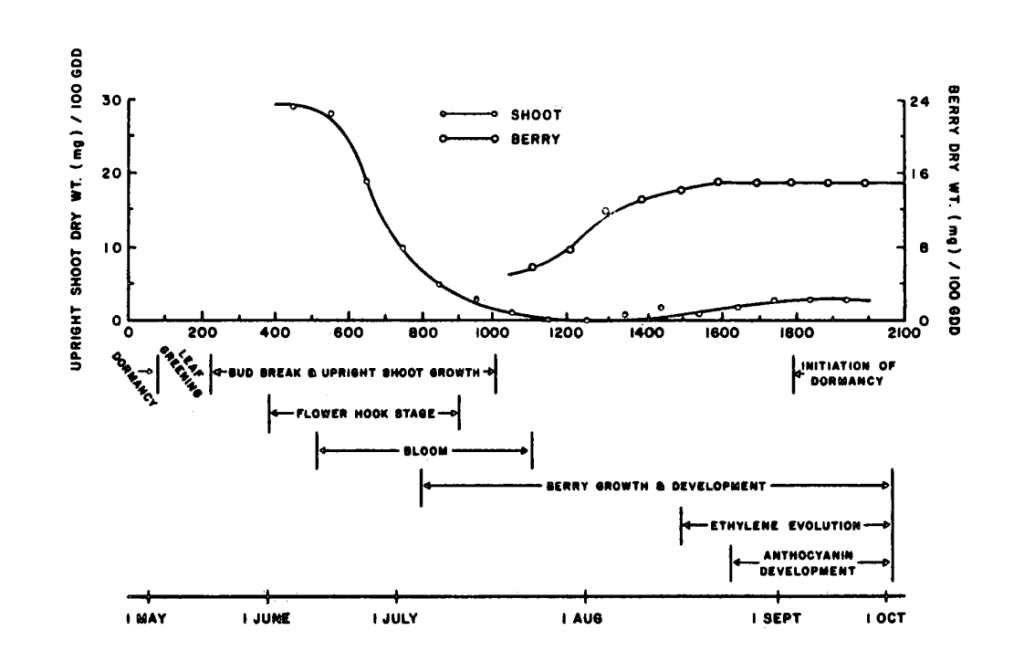
Finally, for figure 5 I quote from Hawker & Stang directly:
The source-sink relationships within the cranberry plant appear to change throughout the season. For example, with ‘Searles’ at the [central] locations, vines are dormant with purple color until the beginning of May (75 GDD), greening up by mid-May (220 GDD). Following this is [a] period of rapid upright growth with the new growth apparently acting as the sink for metabolites and the old leaves and stems forming the source. Flowers from uprights begin the hook stage by the end ofMay (375 GDD) and blossoms open two weeks later (510 GDD). At around 850 GDD (early July), blossoms and early formed berries become the major sink as evidenced by dry weight increase. By mid-July (1000 GDD), upright growth ceases and the berries become the plant’s major sink until the end of the growing season. Following this, new upright leaf growth may become the major source of carbohydrates as a result of their advantageous position for interception incoming radiation. Ethylene evolution begins after 1500 GDD and anthocyanin development after 1650 GDD. By 1800 GDD (early September), the leaves begin to take on dormant purple color in response to low temperatures and shorter day length.