Disease Pressure Lessons From Thermal Imagery
Born from a desire to understand his vines better in order to manage them better, Wes Normington has explored thermal imagery of his marsh since 2018. Already he has learned some things that may be of value to growers—first, the ability to identify disease pressure sooner than physical symptoms show up on the vines; and second, the fact that last year’s leaf pile can lead directly to disease hot-spots this year. Wes will continue to scout with thermal imagery, and he will also relocate his leaf pile.
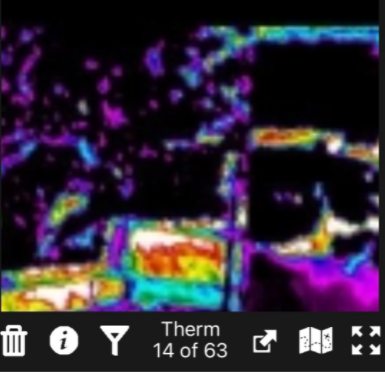
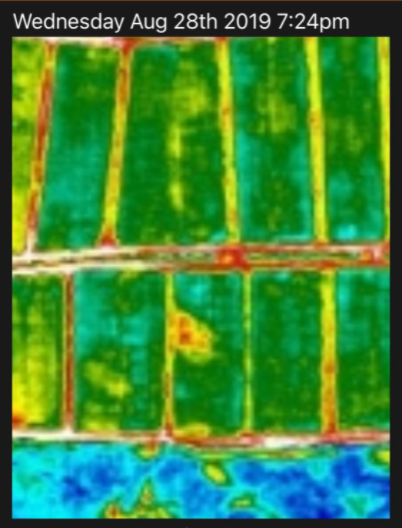
A quick note: these images show purple as coldest, then blue, aqua, green, yellow, with orange being hot, red being very hot, and white being hottest.
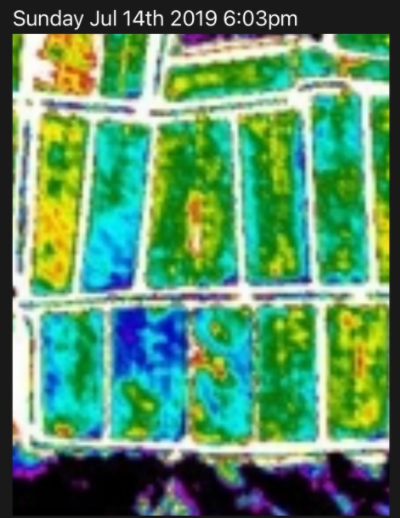
In early July, distinct color differences were visible on two beds in the south block. One showed cool, blue regions. The center bed, marked with an orange banner, had a red “hot spot”. Two beds further to the north showed consistently warm, as well.
The four beds were scouted. The two consistently warm beds had been sanded, and so their warmth was from the hot sand. The north hot bed was a recent renovation so had a lot of sand showing yet which shows hot. The south had Cottonball and had a leaf pile in the corner from past years’ harvest. The cool, dark blue areas on the adjacent bed were identified as areas that were retaining water. Scouts could not determine what was causing the hot spot in our center bed (which is planted to Haines). Curious about the mystery, the team at Saddle Mound ran tissue tests for all nutrients during the season and didn’t find any deficiencies with these vines.
By late July, the water retention issue had been resolved, but the hot spot in our center bed was still bright on the thermal scans—but still showed nothing when scouts put boots on the ground. The wider bed to the north, which is slightly too wide for the boom to access the center, shows a similar hot spot, which will be a clue—it is obvious in the thermal imagery, but no difference is apparent to the eye.
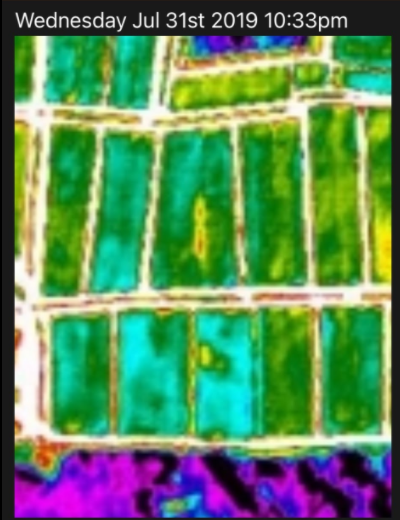
Finally, in August, the hot spot that remained in the thermal imagery showed up in the bed—it was early rot. This block of beds had received a light rate of fungicide, since they are newer plantings. No signs of disease were visible to the human eye until 6 weeks after stress was first noticed by the thermal imaging system.
Armed with the information that unexplained heat, picked up by thermal imaging, can indicate active plant pathogen presence even before human scouts can detect it, Wes went into the next season with a critical eye.
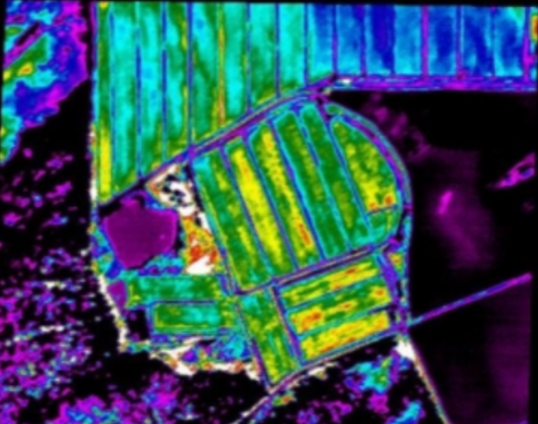
He identified some of the hottest conditions in areas of beds where leaves had collected after a spring bug & leaf flood, for example the northwest corner of the bed pictured here. He also noticed a bright white spot at the intersection where he piles his compost during harvest. Of course the heat generated by decomposition of the leaves causes the pile itself to be hotter than surrounding beds—but he also noticed a gradient across his beds. While some beds are ‘hotter’ than their neighbors because earlier varieties “warm up” sooner than later ones, other beds are hotter than their neighbors of the same variety. Even though you don’t know the varieties Wes has on each bed, you can see a gradient: the closer the bed is to the leaf pile, the greater the plant stress—this could very well be caused by disease.
After just two years of exploration with a new technology, Wes found an action that he could take that might improve disease pressure on his marsh. In 2021, he will put leaves in a new pile, further from his production beds. And he will, of course, continue to monitor his vines and berries for yield and quality—but this could be the beginning of a new level of understanding.
Thanks to Wes and the Saddle Mound team for sharing their experience and knowledge!