Cold Hardiness Modeling for Grapes: A Grower-Friendly Tool for Assessing Cold Damage Risk
As we enter the winter season, many growers are once again thinking about the risk of cold injury to grapevines. With increasingly unpredictable weather patterns, including warm spells followed by abrupt cold snaps, it often feels like we are always on alert for potential damage. During the dormant season, freeze injury to buds remains the number one concern, as even the hardiest cultivars can be vulnerable when temperatures fall below their level of cold hardiness.
There has been extensive research on how to measure and understand cold hardiness in grapevines, but the techniques we use, such as laboratory-based bud freezing assays, are not practical for growers to perform on their own. These assessments are typically carried out by researchers and extension specialists at universities and research centers. As a result, growers have had limited ways to know, in real time, how cold hardiness is changing in their own vineyards.
To address this gap, a team from the University of Wisconsin–Madison (Amaya Atucha and Al Kovaleski) partnered with colleagues at Cornell University (Jason Londo and Dan Olmstead), supported by a USDA NIFA CARE grant (2023-68008-39274), to develop a practical, grower-facing prediction tool: the Grape Cold Hardiness Risk Assessment. Built on many years of research, this tool is now available through the NEWA (Network for Environment and Weather Applications) platform and allows growers to monitor predicted cold hardiness of grapevines throughout the dormant season.
In addition to evaluating cold hardiness and helping growers anticipate winter injury risk, the Grape Cold Hardiness Risk Assessment tool can also be used when considering potential vineyard sites. By running the model for a proposed location and cultivar, such as assessing whether Cabernet Sauvignon would regularly fall below its hardiness threshold, growers can make more informed decisions about cultivar selection and site suitability before planting.
Understanding Cold Hardiness in Grapevine Buds
Cold hardiness is a vine’s ability to tolerate freezing temperatures, and it changes continually throughout the dormant season. Buds gain hardiness in the fall as temperatures cool and daylength shortens, reach their peak tolerance in midwinter, and then gradually lose hardiness during late-winter warm spells (Figure 1). Because this process is dynamic, buds can be damaged at several points in the season whenever temperatures fall below what the buds can tolerate at that time.
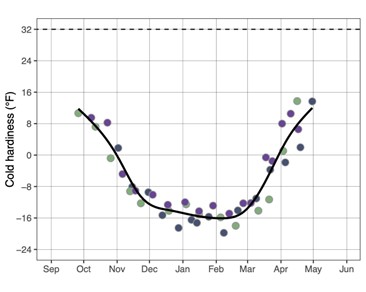
A vine’s hardiness level is strongly linked to the temperatures it has experienced. Researchers use techniques such as differential thermal analysis to determine the LT50, the temperature at which half of the buds would be expected to die. LT50 serves as a practical threshold for injury risk and changes throughout the winter as buds acclimate and deacclimate.
Because cold hardiness is driven by temperature, weather data can be used to model and predict LT50 for many grape cultivars, including both hybrids and vinifera. These predictions help growers judge whether a cold event might cause injury, evaluate potential bud damage after a freeze, and make informed pruning and management decisions. Access to real-time hardiness estimates provides a clearer picture of winter injury risk and supports better vineyard decision-making.
How the Grape Cold Hardiness Risk Assessment Tool Works
The tool, available on the NEWA (Network for Environment and Weather Applications) platform, uses real-time or gridded weather data to estimate bud cold hardiness and identify periods when cold injury is likely for more than fifty grape cultivars.
Step 1: Choose your location
You can run the tool using either a NEWA weather station or gridded climate data.
- Using a NEWA station: Select the station closest to your vineyard and the model will automatically use current and historical weather data from that site.
- Using Grid Data: Enter the coordinates of your vineyard or proposed site. The model will use interpolated weather information from the Northeast Regional Climate Center. This option is ideal for growers without a nearby NEWA station and for evaluating vineyard establishment at new locations.
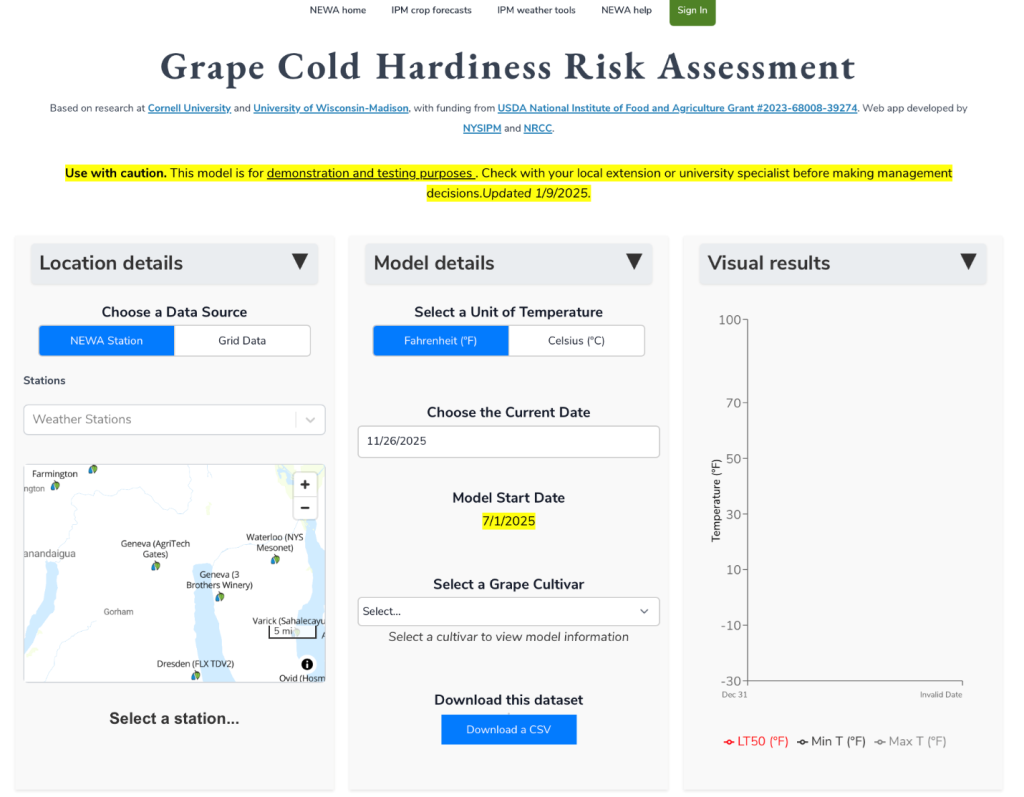
Step 2: Set model parameters
After selecting the location, choose the settings for your run.
- Choose whether you want temperatures displayed in Fahrenheit or Celsius.
- Select the date you want the model to run through. The model always begins calculations on July 1 of the current season and estimates bud cold hardiness from that date up to the selected day.
- You can choose a past date to review whether damage may have occurred.
- You can select today’s date to view current conditions.
- If your selected date includes forecasted days, the tool will project future LT50 values (temperature at which half of the dormant buds would be expected to be killed by freezing) using the available weather forecast.
Select the grape cultivar you wish to evaluate. You can run additional cultivars by repeating this step. A downloadable dataset is also available for growers who want to store or analyze the results
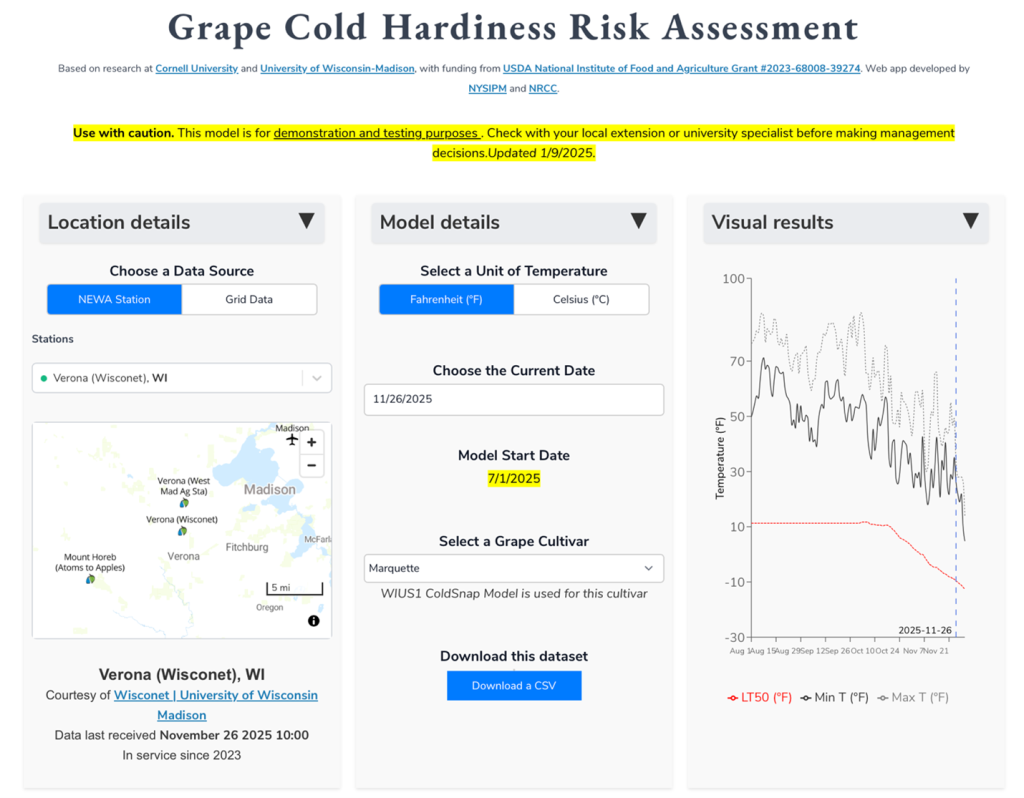
Step 3: View the Results
The results panel displays a graph of predicted cold hardiness alongside weather conditions.
- The Y axis shows temperature and the X axis shows dates.
- The solid dark line represents the minimum daily temperature, and the dashed grey line represents the maximum daily temperature.
- The red dashed line labeled LT50 represents the model’s prediction of the temperature at which fifty percent of the buds would be expected to die.
- A vertical blue dashed line marks the current date within the selected period.
- If the minimum temperature line drops below the red LT50 line, this indicates that the air temperature has fallen below the freezing tolerance of the buds at that time, and cold damage is likely to have occurred.
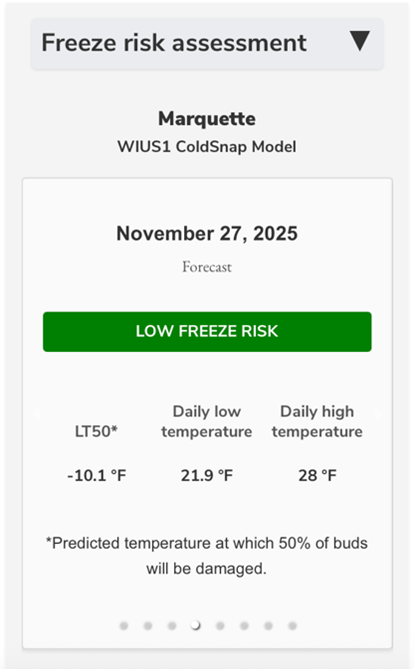
Step 4: Review the cold damage risk forecast
The tool also provides a color coded summary of the predicted freeze risk for the date you selected.
- The risk level is displayed as Low, Medium, or High based on how predicted temperatures compare to the LT50.
- Additional dots on the panel allow you to view up to six future days of risk predictions. Selecting a dot displays the likely risk level for that day based on the weather forecast.
These features allow growers to anticipate upcoming cold events, evaluate recent ones, and make informed management decisions during the dormant season.
Grower Takeaways
- Bud cold hardiness changes throughout the dormant season and depends on the temperatures the vine has recently experienced.
- The LT50 value tells you the temperature at which fifty percent of buds would be expected to suffer cold damage.
- The Grape Cold Hardiness Risk Assessment tool predicts LT50 for more than fifty cultivars using real-time and forecasted temperature data.
- If minimum temperatures fall below the predicted LT50, bud injury is likely.
- The tool works with any NEWA weather station or with gridded climate data by entering your vineyard’s coordinates.
- Forecasted risk levels help growers anticipate upcoming cold events and plan protective actions.
- The model can also be used to assess potential new vineyard sites by comparing cultivar specific hardiness needs with the site’s temperature patterns.