Grape Cultivar Developmental Stages: July 8, 2020
Phenology
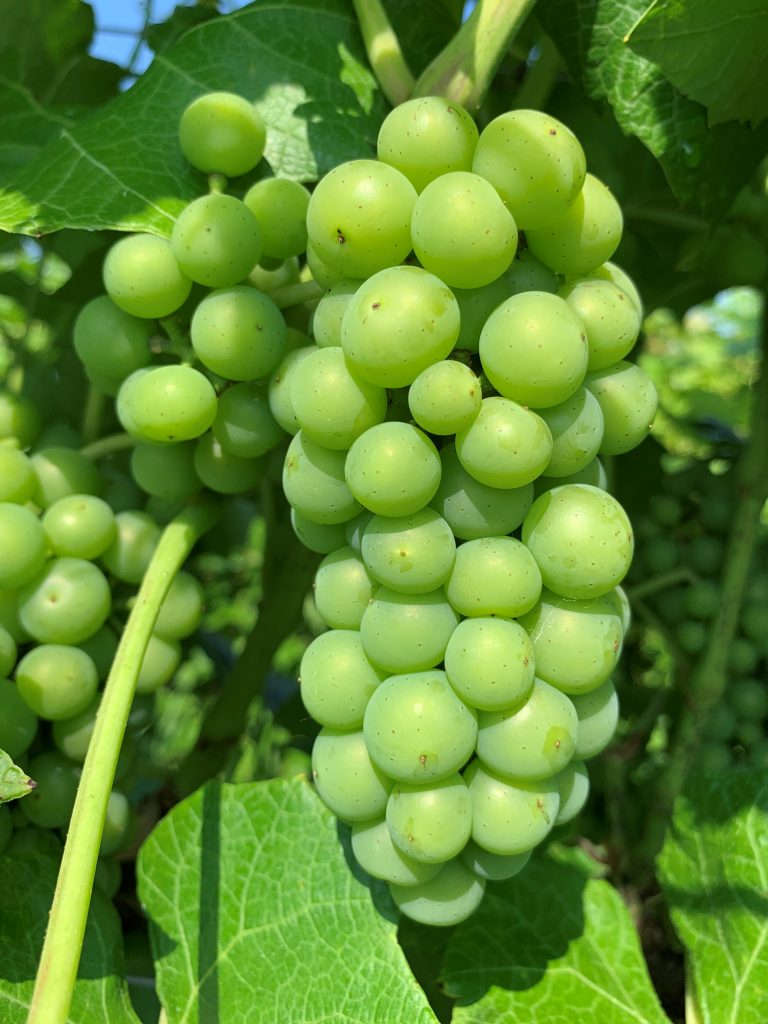
At the West Madison Agricultural Research Station (WMARS) in Madison, WI, as of July 8, all cultivars were at shoot development E-L* stages 31 (“Berries pea-size, 7 mm”) to some shoots at stage 32 (“Beginning of bunch closure, berries touching (if bunches are tight)”).
If you haven’t already considered it, the management practice of leaf pulling might be useful for your vineyard. The removal of 2 to 3 basal leaves and laterals from around the clusters after fruit has set and berries are expanding has the effect of significantly increasing the amount of light that reaches the fruiting zone. Greater light exposure also results in higher berry temperatures. Research from our program and others’ has shown that this canopy management practice can help to reduce malic acid levels in the fruit, while also increasing anthocyanins in red cultivars.
At WMARS, our high cordon shoots are reaching the ground and we will skirt them soon by cutting back the extra growth to just above ground level in order to keep them out of the aisles.
Brianna 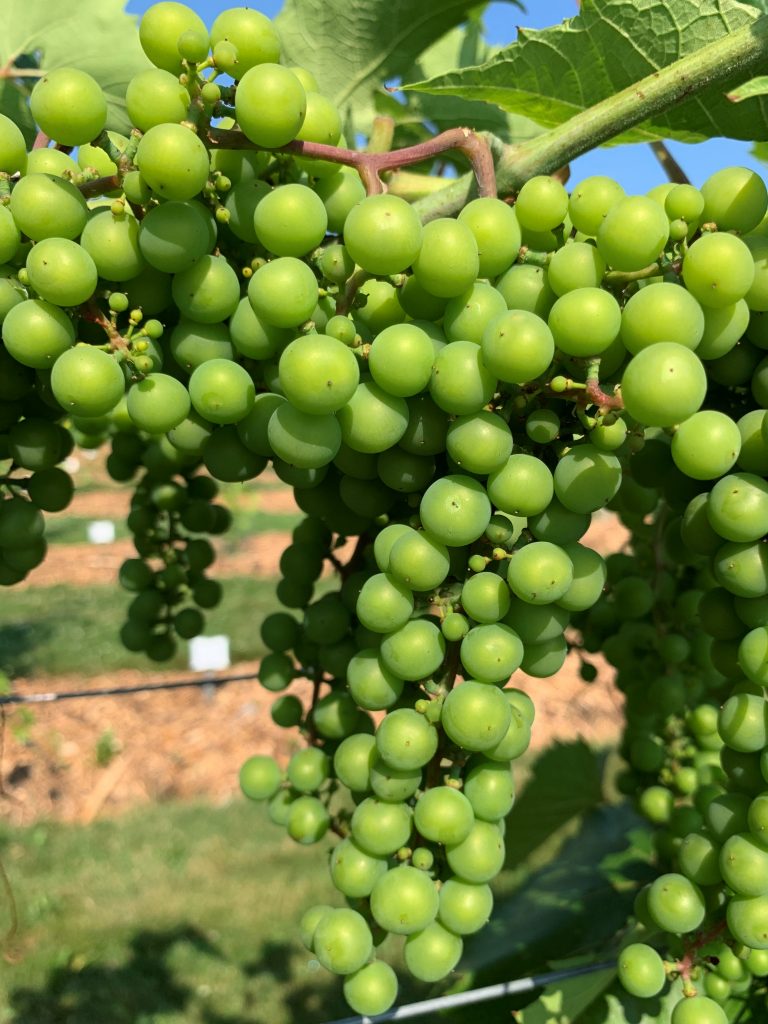
Crimson Pearl 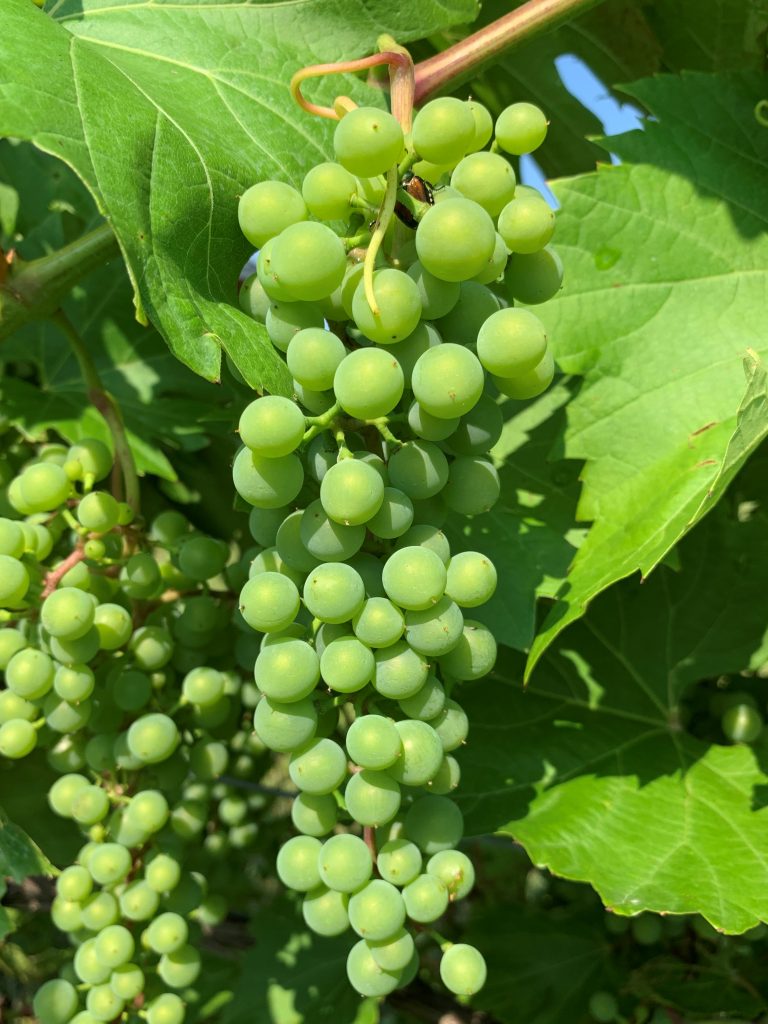
Frontenac 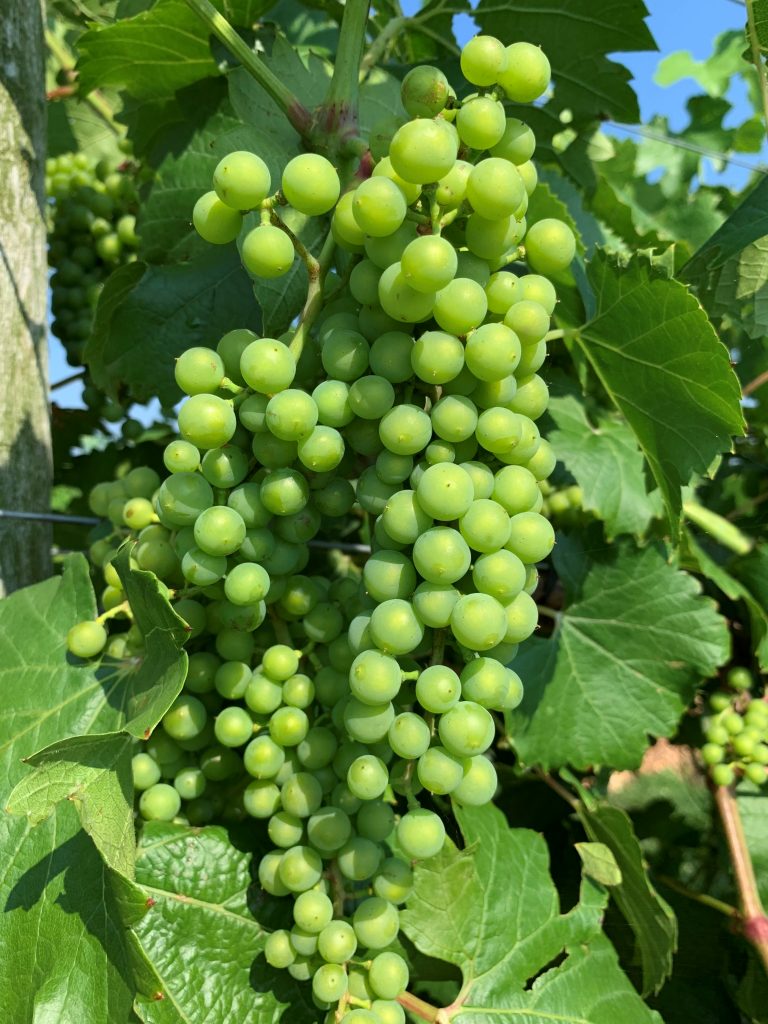
Itasca 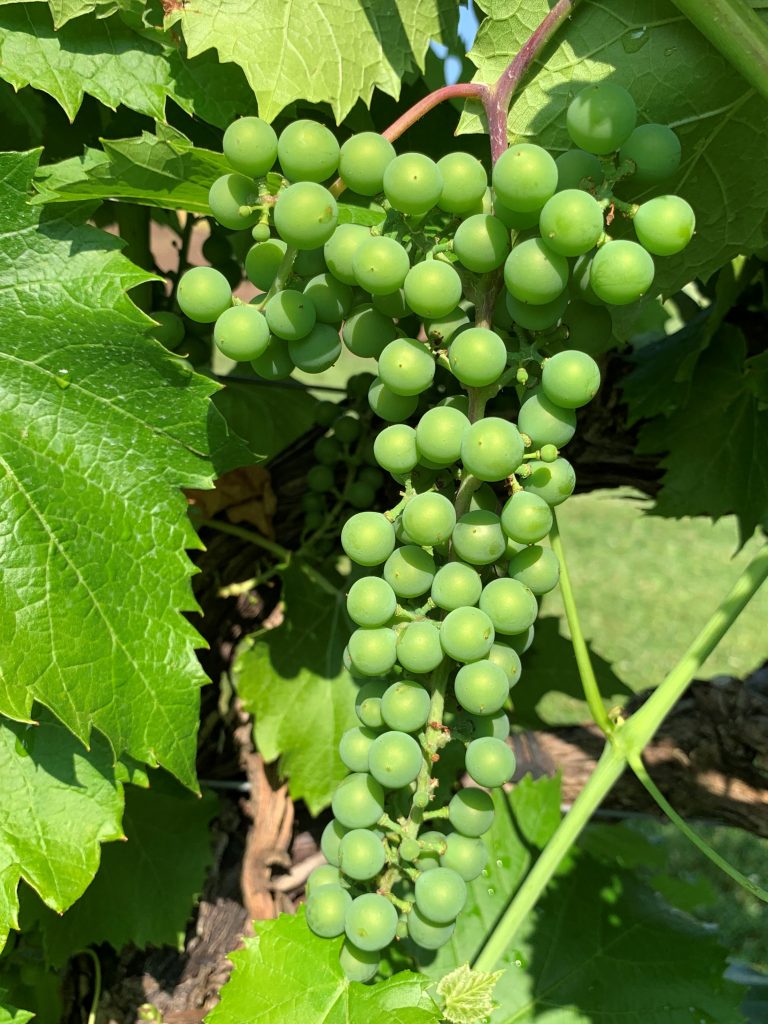
La Crescent 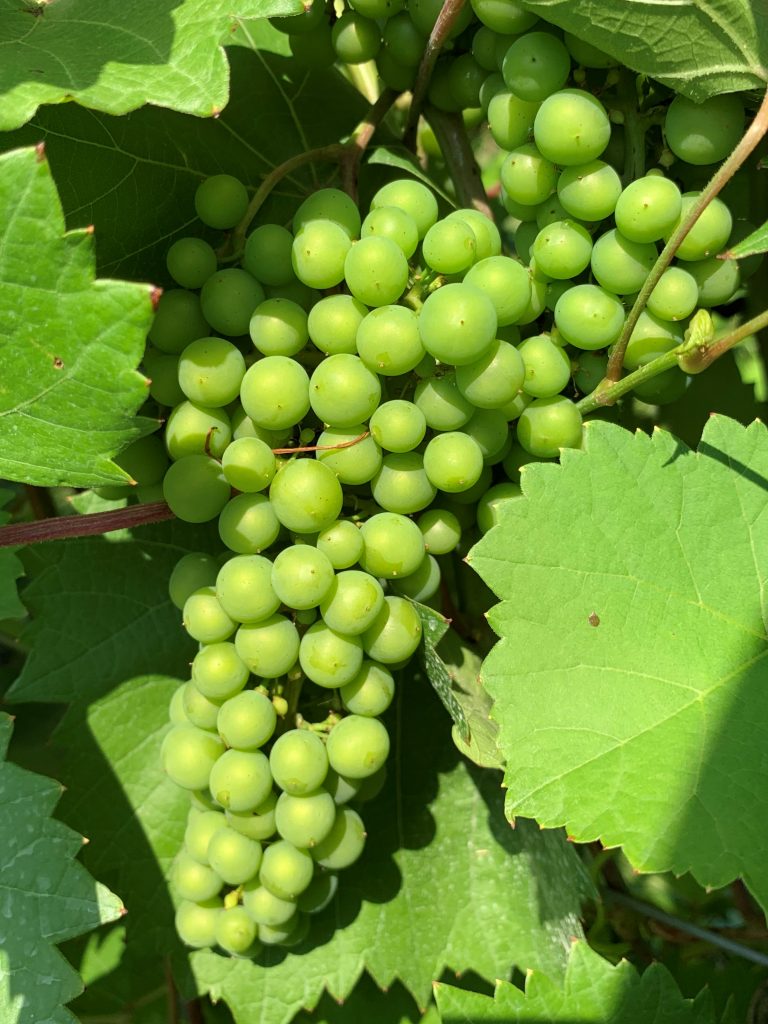
Marquette 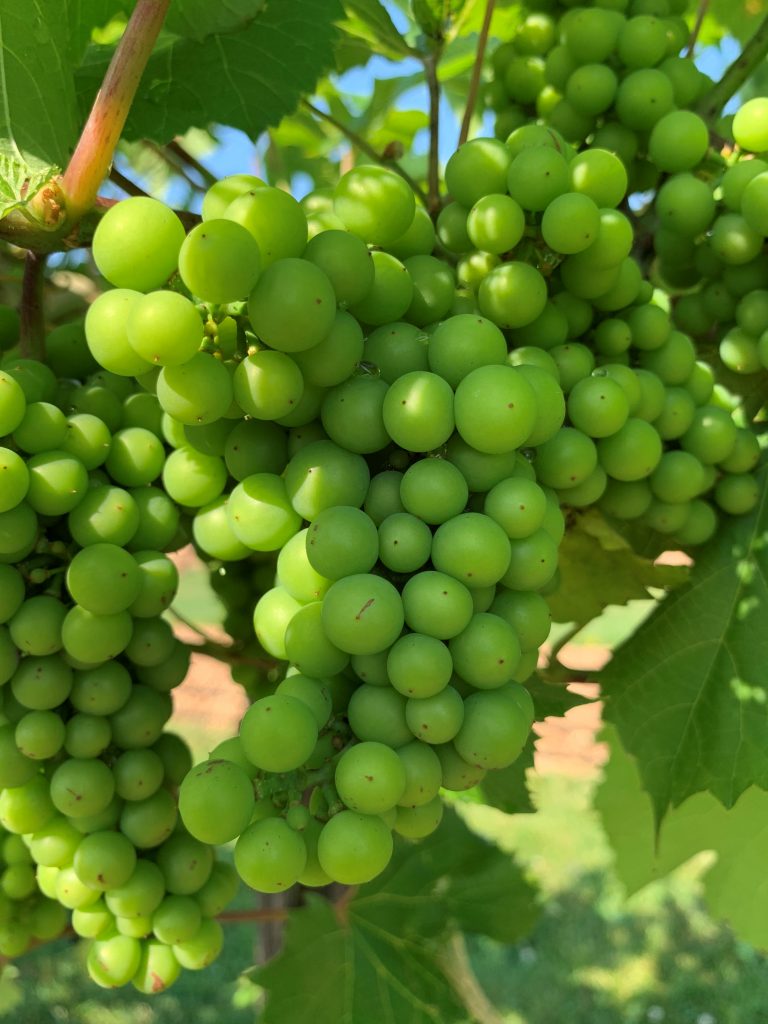
Petite Pearl
All examples at E-L 32 “Beginning of bunch closure, berries touching (if bunches are tight)”. *E-L stands for the Eichhorn-Lorenz growth stages scale to describe grapevine development.
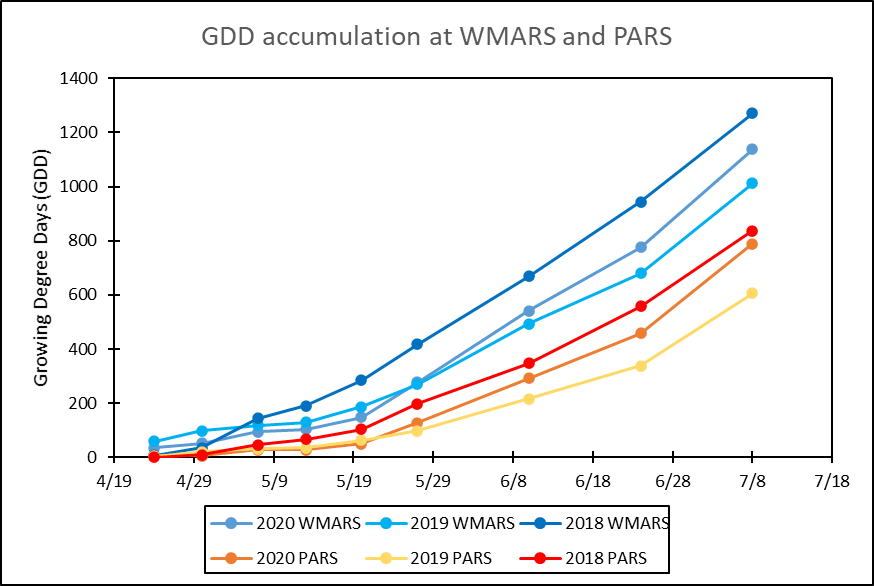
Growing Degree Day (GDD) Accumulations
Depicted in the table and on the graph are the GDD accumulations from April 1 through July 8 for this season and the past two seasons. Currently at WMARS, the GDD accumulation for the 2020 season is approaching the total to date heat experience of 2018. The temperature experiences at both WMARS and Peninsular Agricultural Research Station (PARS) over the last two weeks was much warmer than in either 2018 or 2019 for the same period (note the 2020 lines for each location are notably steeper than for the other years, showing higher rates of heat accumulation). This is especially interesting at PARS, where the GDD accumulation so far this year is nearly what was reached there in 2018. So, our spring may have been cooler this year, but the summer is making up for that!
We use the NEWA website as our source for GDD data. You can visit their “About degree days” page to learn more about the concept of degree days and the formulas used in calculations.
(http://newa.cornell.edu/index.php?page=about-degree-days).
Growing degree day accumulation as of July 8, 2020 (April 1 biofix date; base 50 °F BE*) at the WMARS and the Peninsular Agricultural Research Station (PARS).
| Location | 2020 | 2019 | 2018 |
| WMARS | 1137.1 | 1012.9 | 1269.9 |
| PARS | 788.8 | 606.0 | 836.7 |
*BE = Baskerville-Emin calculation method