Cold Climate Grape Cultivar Developmental Stages September 2, 2021
Phenology
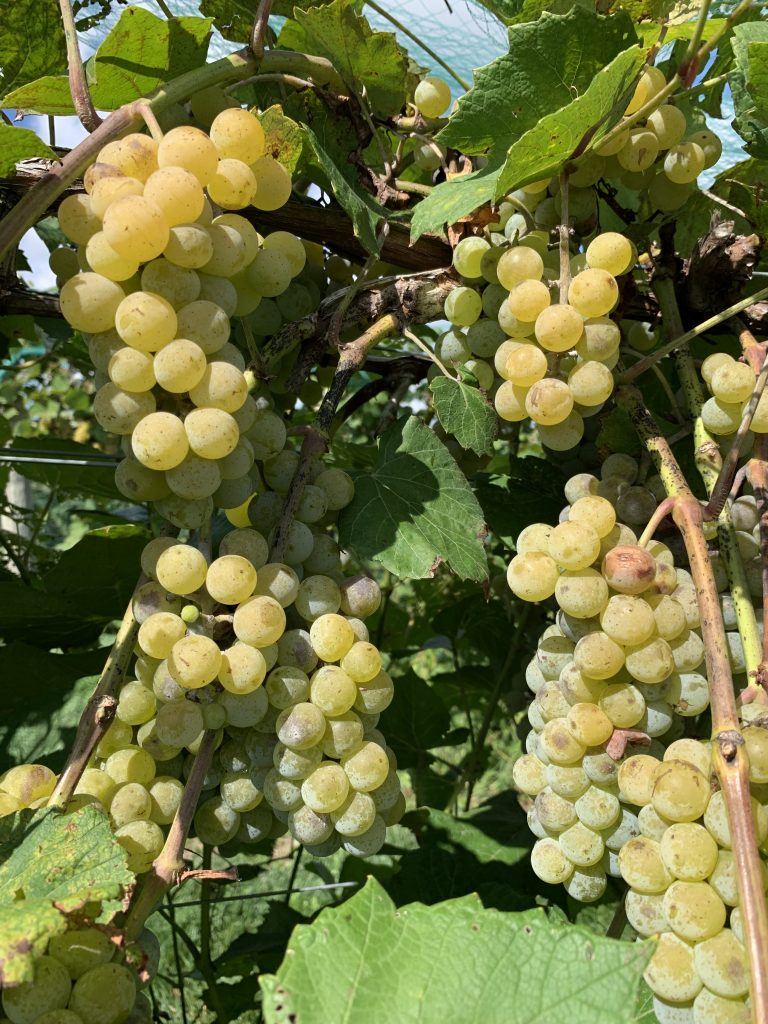
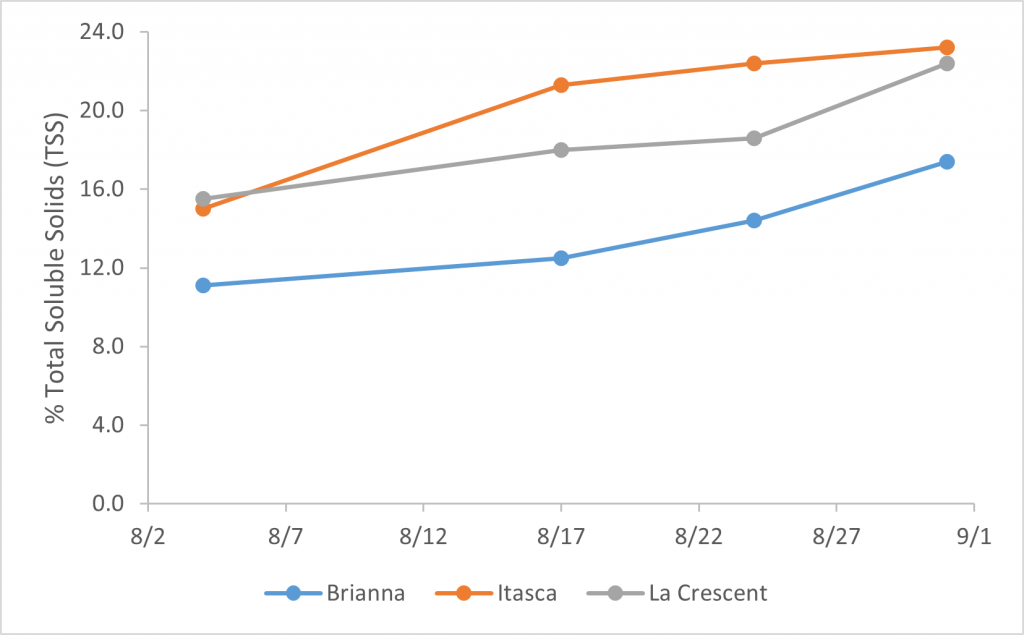
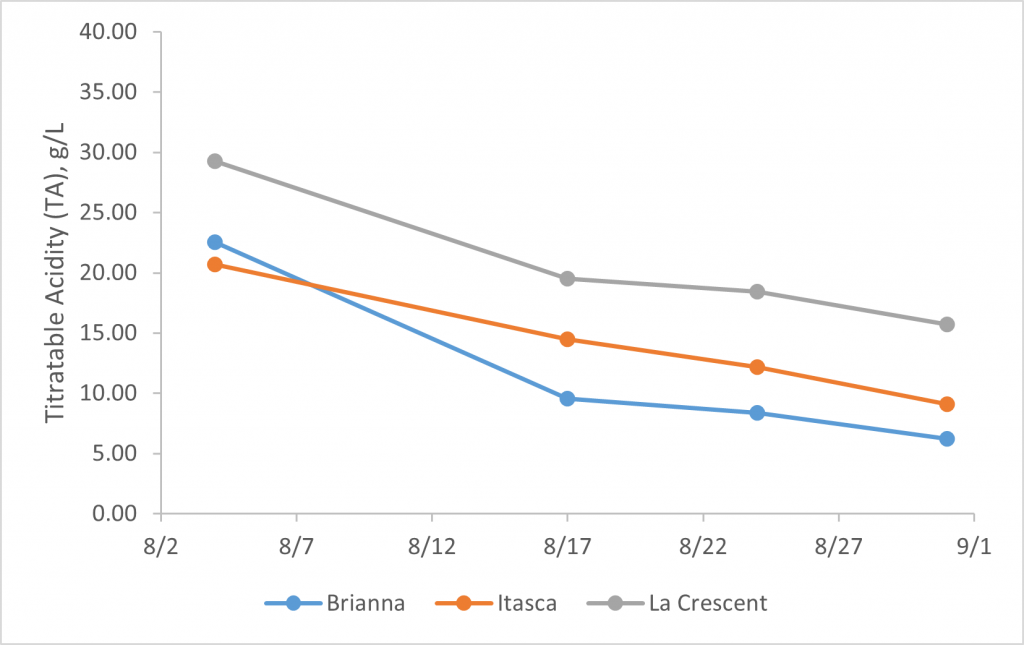
The berries of all cultivars at West Madison Research Station (WMARS) are either not quite ripe (E-L* Stage 37) or are harvest-ripe (stage 38). See Table 1 for veraison (beginning of berry color change) and harvest dates, as well as the final fruit quality parameter readings for each cultivar. This week (September 1) we harvested all of our white cultivars: Brianna, Itasca, and La Crescent. In many years, pollination of Brianna can be hampered by spring rains, but this year we had great fruit set. Although this cultivar also experienced significant levels of powdery mildew this year, clusters were full and tight. With its early high sugar levels (above 20.0 %TSS by mid-August), Itasca was very attractive to the birds unfortunately, reminding us that we will need to put the bird netting up sooner than we might think! This year we were able to harvest La Crescent before its characteristic shelling (dropping) of berries began in earnest. In addition, conditions this year allowed this cultivar to attain good sugar levels while dropping to a reasonable acidity.
*E-L stands for the Eichhorn-Lorenz growth stages scale to describe grapevine development.
Brianna 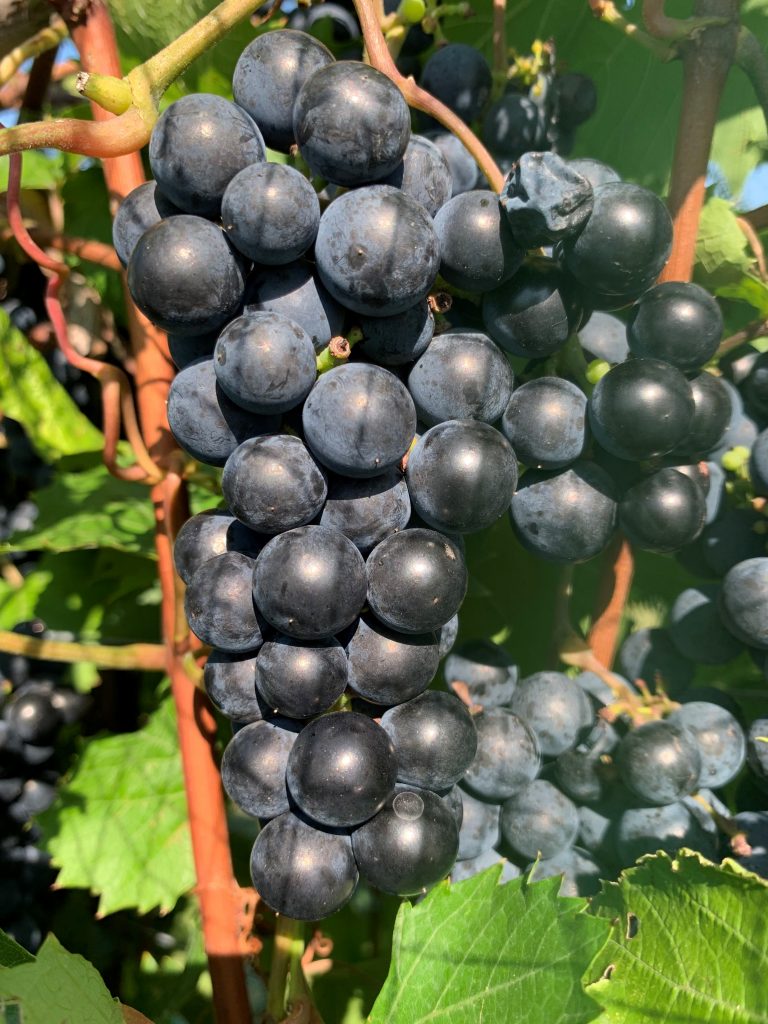
Crimson Pearl 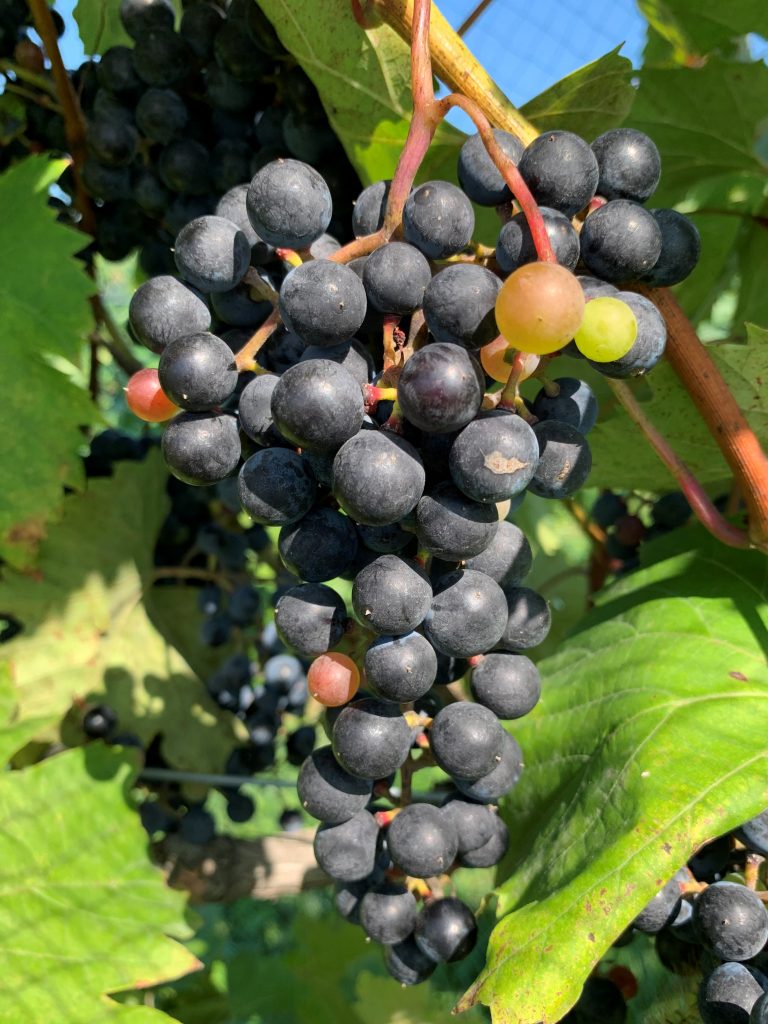
Frontenac 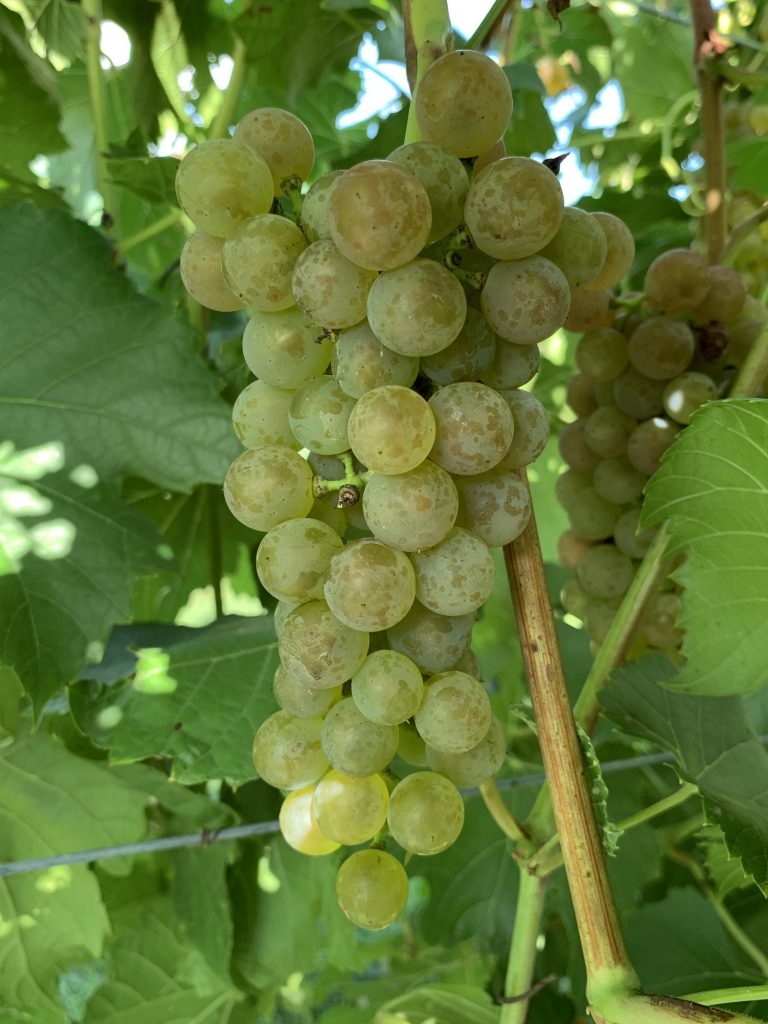
Itasca 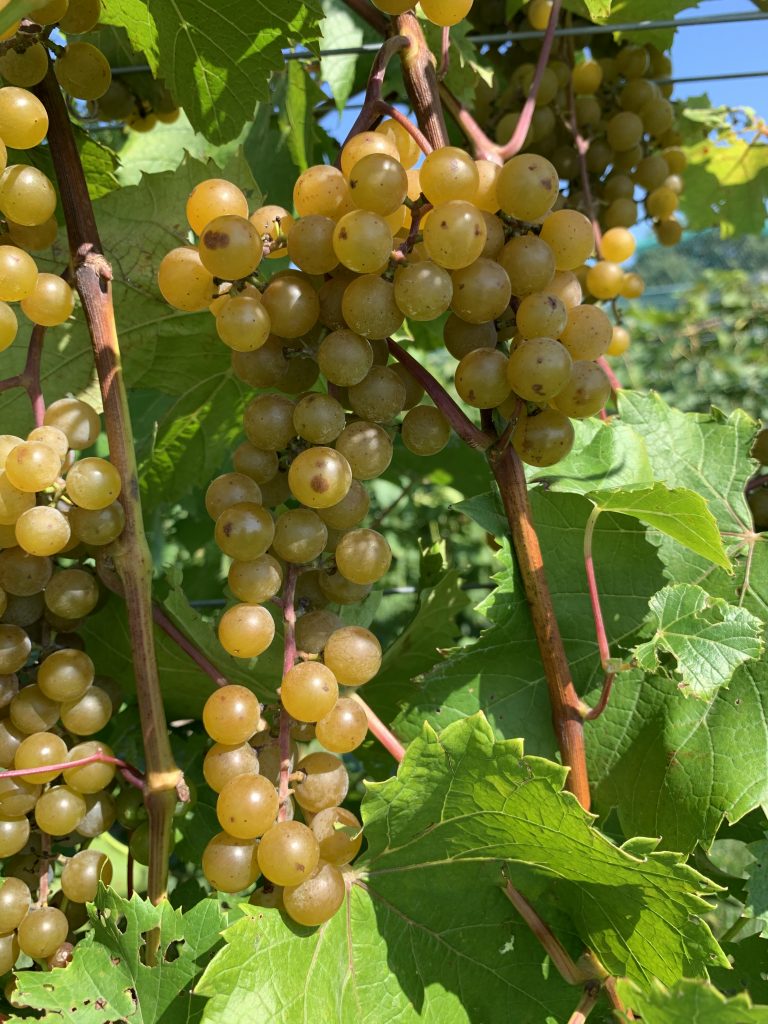
La Crescent 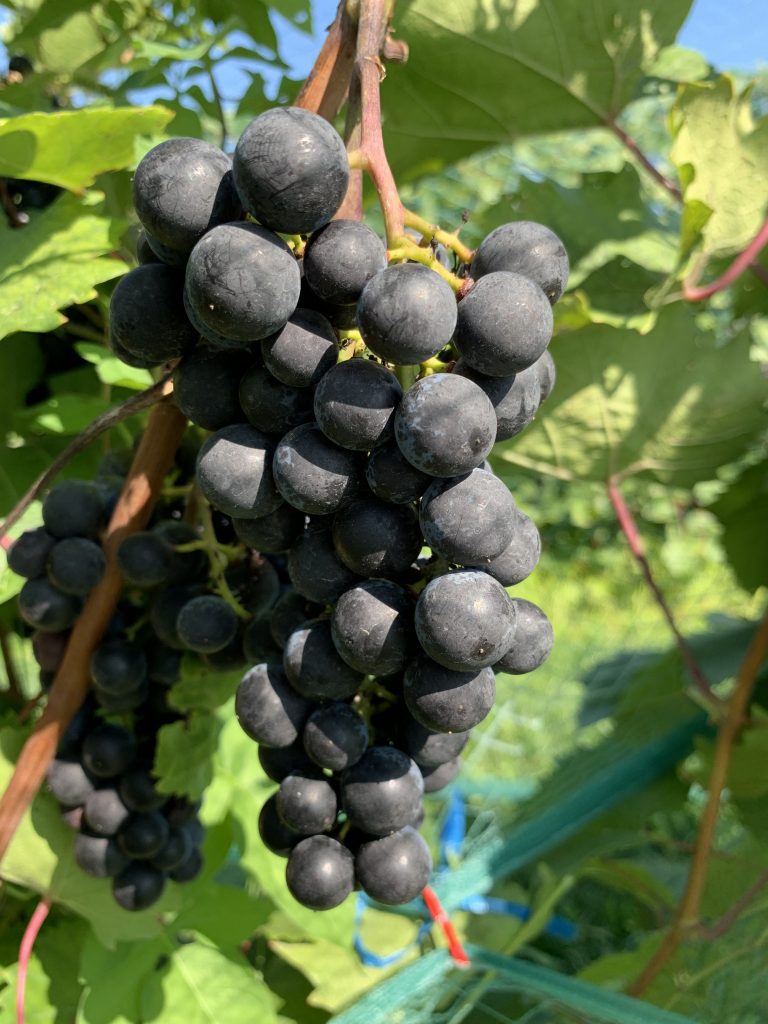
Marquette 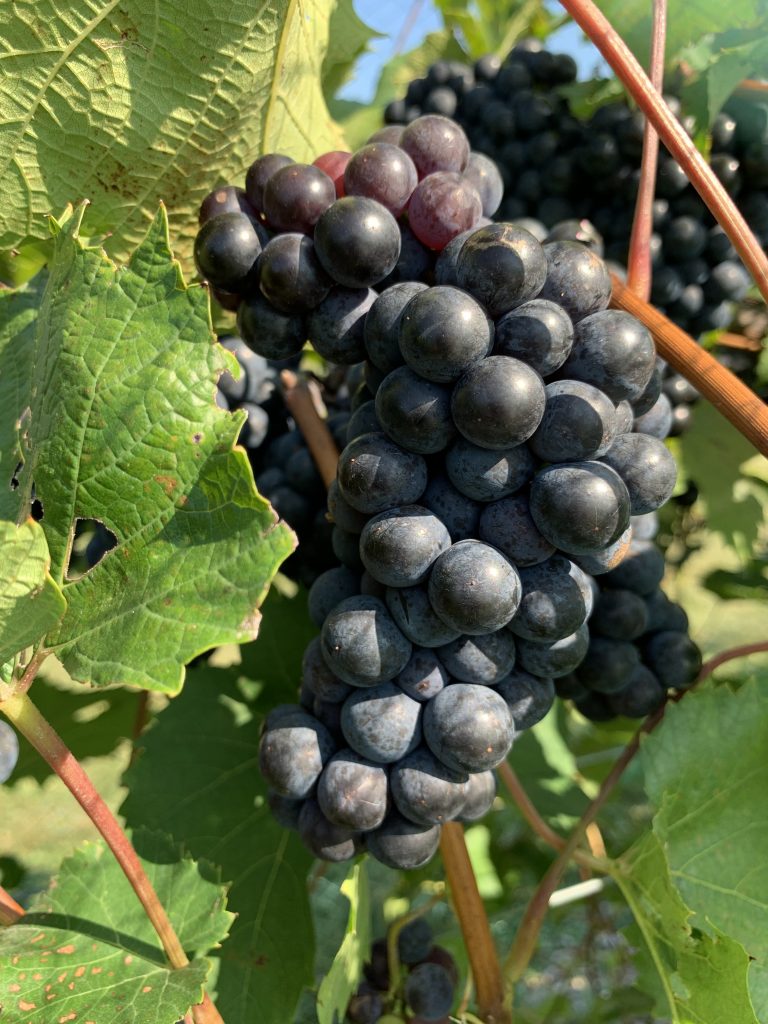
Petite Pearl
Figure 1. Ripening clusters of grape cultivars at the West Madison Agricultural Research Station, as of August 4.
Berry Ripening Parameters
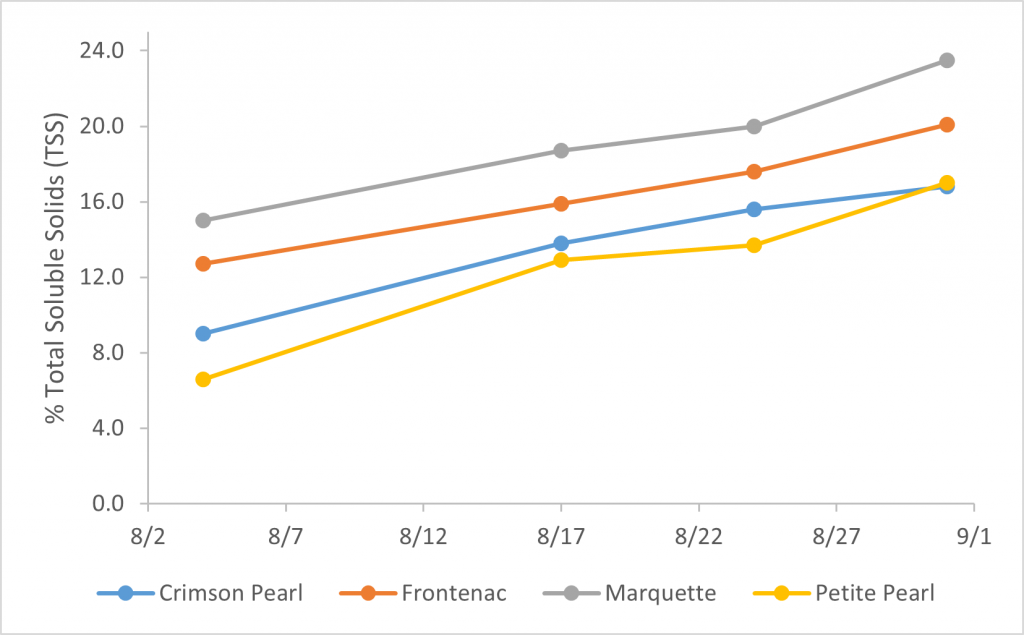
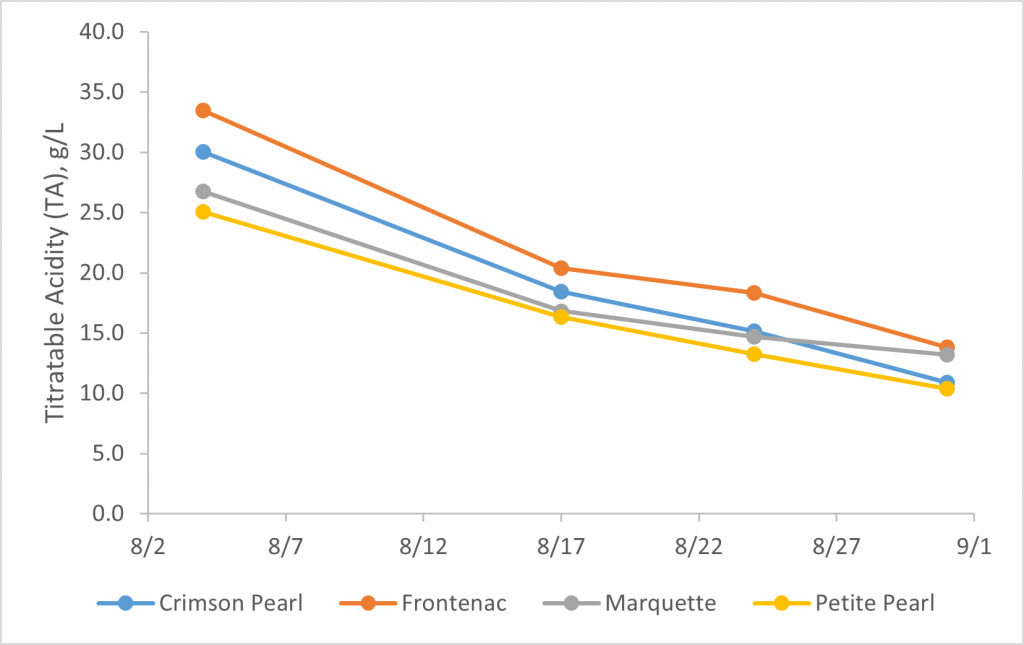
Below are graphs showing the progression of the berry ripening parameters at WMARS: % total soluble solids (TSS), titratable acidity (TA) concentrations, and pH. All cultivars reported here are grown on the high cordon training system.
TSS is a measure of the density (mass/volume) of all the soluble solids in grape berry juice and is determined easily using a refractometer as %TSS. Sugars (mainly glucose and fructose) comprise 95-99% of the TSS in grape juice and so %TSS is good stand-in measure for sugars. It is common for people to use %TSS and °Brix interchangeably when referring to sugar levels in fruit. Other constituents of TSS include organic acids, phenolic compounds, nitrogenous compounds, and structural polysaccharides. Hydrometers utilize various scales, including ºBrix, and measure the sucrose (a disaccharide composed of one unit of glucose and one unit of fructose) concentration in aqueous solution (1 ºBrix = 1 g sucrose / 100 g solution = 1%).
The concentration and strength of acids in grapes is accounted for in two ways: TA and pH. TA measures both the dissociated (free hydrogen ions) and un-dissociated acids (such as in organic acids). The main organic acids in grapes are tartaric and malic acids, with citric acid a distant third. TA is measured by titration of the sample with a base (an alkaline solution), such as sodium hydroxide, and is expressed as a concentration (g/L) on the basis of tartaric acid equivalents. The values determined are a good indication of the sensory perception of tartness. The pH of substance is a measurement of the concentration of dissociated free hydrogen ions, expressed on a unitless scale from 1 (acidic) to 14 (basic).
% Total soluble solids (proxy for sugars)
Titratable acidity (tartaric acid equivalents)
pH (concentration of free hydrogen ions)
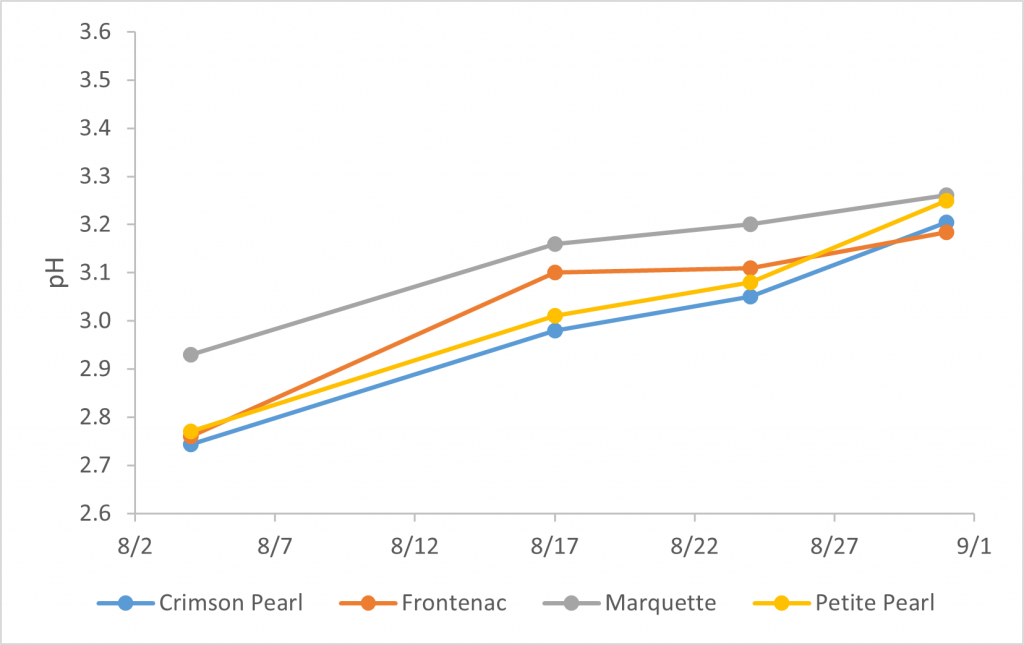
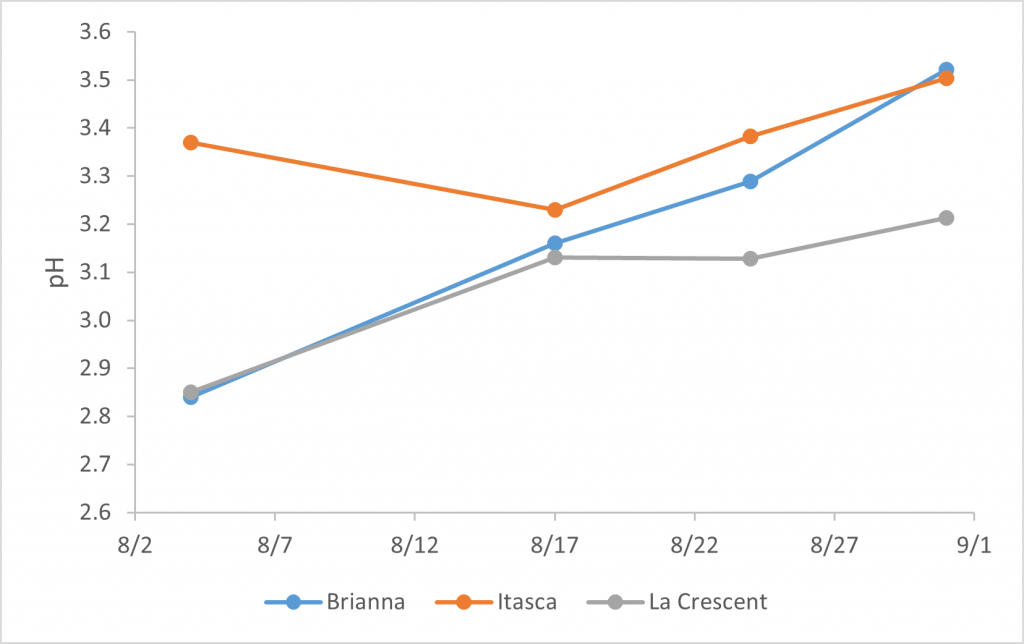
Figure 2. Percent total soluble solids (%TSS), titratable acidity (TA), and pH of the berry juice from the cold climate interspecific hybrid grape cultivars at the West Madison Agricultural Research Station.
Table 1. Veraison and harvest dates and harvest fruit quality parameters of total soluble solids (TSS), titratable acidity (TA), and pH of the cold climate interspecific hybrid grape cultivars at the West Madison Agricultural Research Station in Verona.
| Wine color | Cultivar | Date reached Veraison at WMARS | Harvest date | Harvest TSS (%) | Harvest TA (g/L) | Harvest pH |
| Red | Crimson Pearl | 7/27 | ||||
| Frontenac | 7/27 | |||||
| Marquette | 7/24 | |||||
| Petite Pearl | 8/1 | |||||
| White | Brianna | 7/30 | 9/1 | 17.4 | 6.20 | 3.52 |
| Itasca | 7/20 | 9/1 | 23.2 | 9.11 | 3.50 | |
| La Crescent | 7/30 | 9/1 | 22.4 | 14.34 | 3.16 |
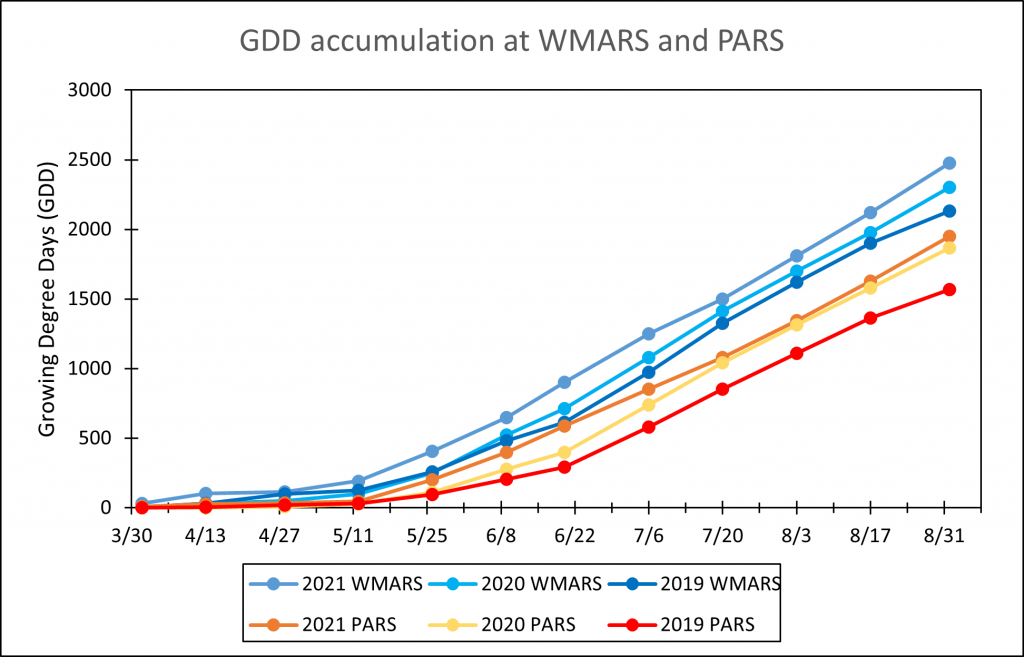
Growing Degree-Day (GDD) Accumulations
Depicted in Figure 3 and listed in Table 2 are the GDD accumulations from April 1 to September 1 for this year and the past two seasons at WMARS and the Peninsular Agricultural Research Station (PARS). Degree-days were calculated using a base 50 °F, starting on April 1 as a biofix date. We use the NEWA website and the “BE” (Baskerville-Emin) calculation. This method uses a sine wave instead of a simple average temperature calculation, which is thought to provide a more accurate estimation of degree-days. You can visit the NEWA “About degree days” page to learn more about the concept of degree days and the formulas used in calculations. (http://newa.cornell.edu/index.php?page=about-degree-days).
The rates of GDD accumulation at both WMARS and PARS for the later summer have continued the same trends as reported two weeks ago. This year’s season has the greatest GDD accumulation, while 2020 and 2019 had less, in that order. The differences between each of the years’ totals is similar to that of up to four weeks ago. At PARS, the current and 2020 season accumulations are nearly the same, while the 2019 season in mid August is the coolest of any year or location.
Table 2. Growing degree day accumulation as of August 17, 2021 (April 1 biofix date; base 50 °F BE*) at the West Madison Agricultural Research Station (WMARS) and the Peninsular Agricultural Research Station (PARS).
| Location | 2021 | 2020 | 2019 |
| WMARS | 2120 | 1978 | 1899 |
| PARS | 1629 | 1580 | 1365 |
*BE = Baskerville-Emin calculation method