Grape Cultivar Developmental Stages August 19, 2020
Phenology
At the West Madison Agricultural Research Station (WMARS) in Madison, WI, as of August 19, all cultivars are in various stages of fruit ripening, shoot development E-L* stages 36 to 37 (“Berries with intermediate sugar values” to “Berries not quite ripe”). Petite Pearl and Frontenac each have several clusters with many berries that have not fully colored. Many clusters of Itasca and La Crescent visually appear to be at a more advanced stage of ripening.
Brianna 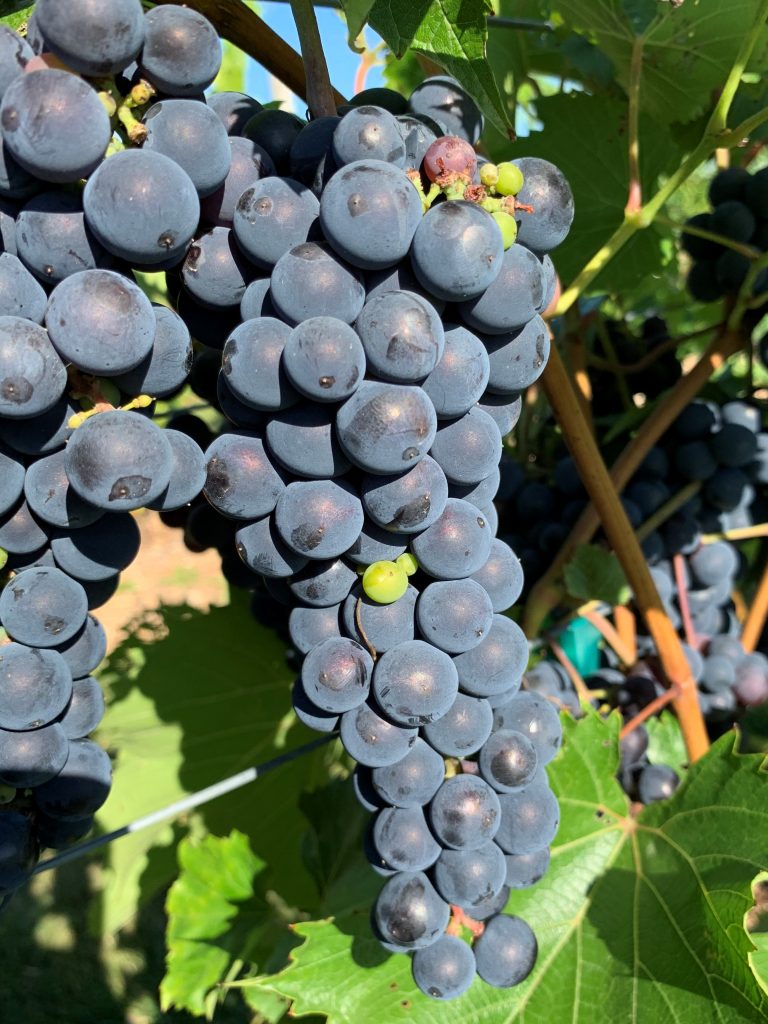
Crimson Pearl 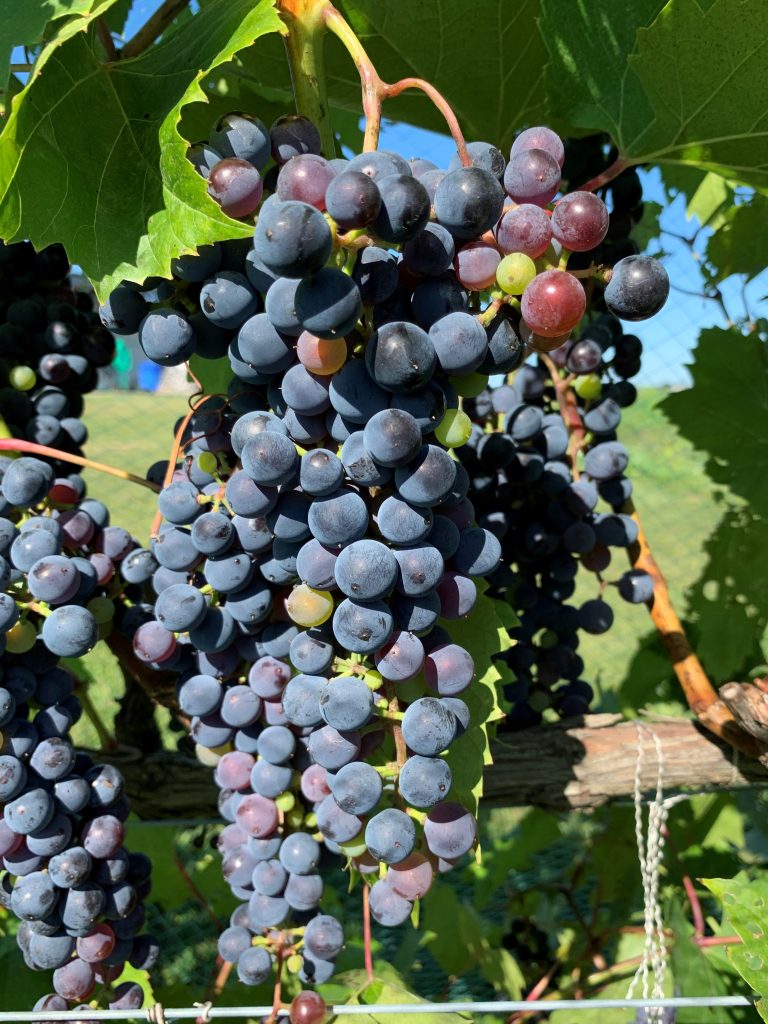
Frontenac 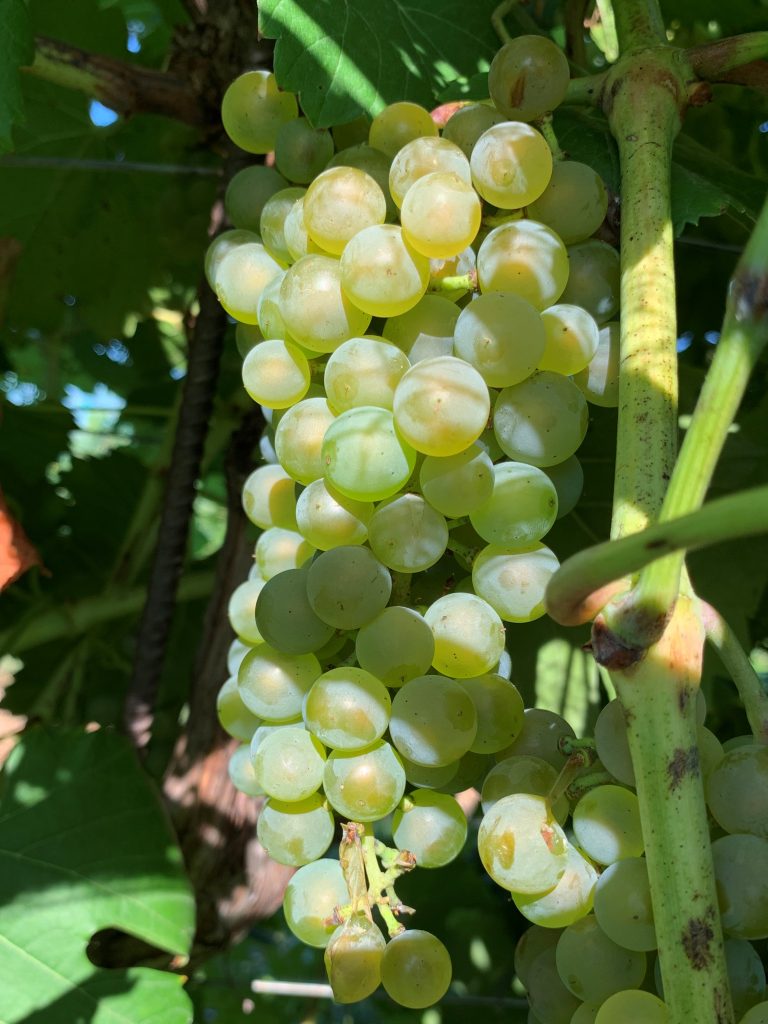
Itasca 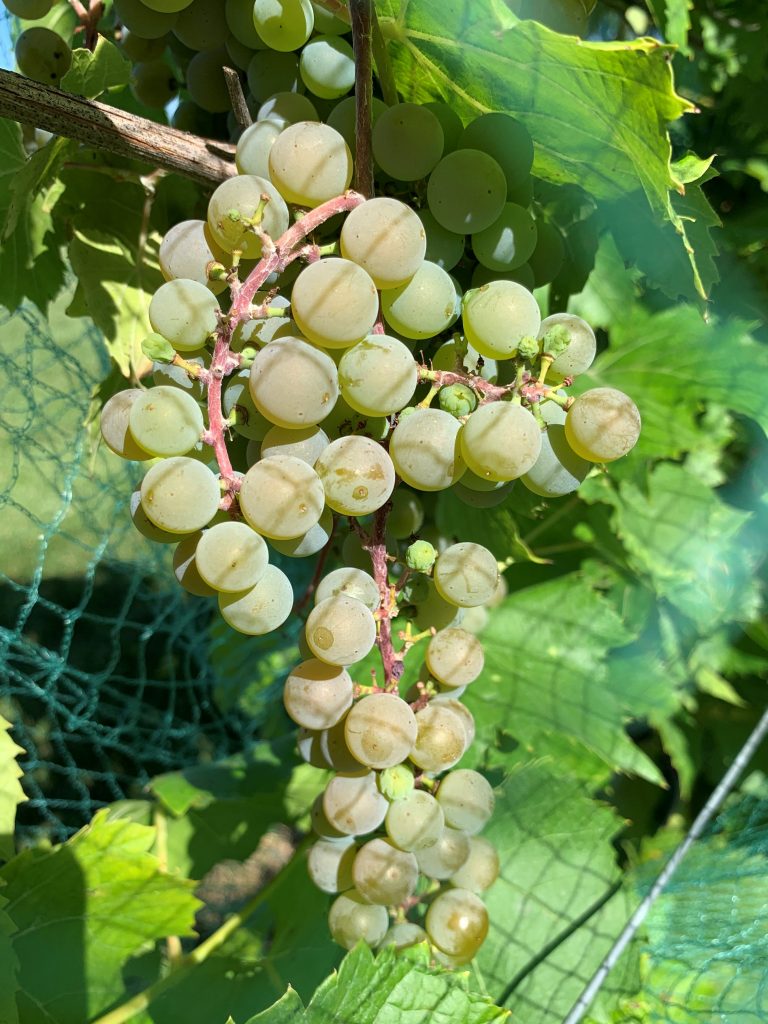
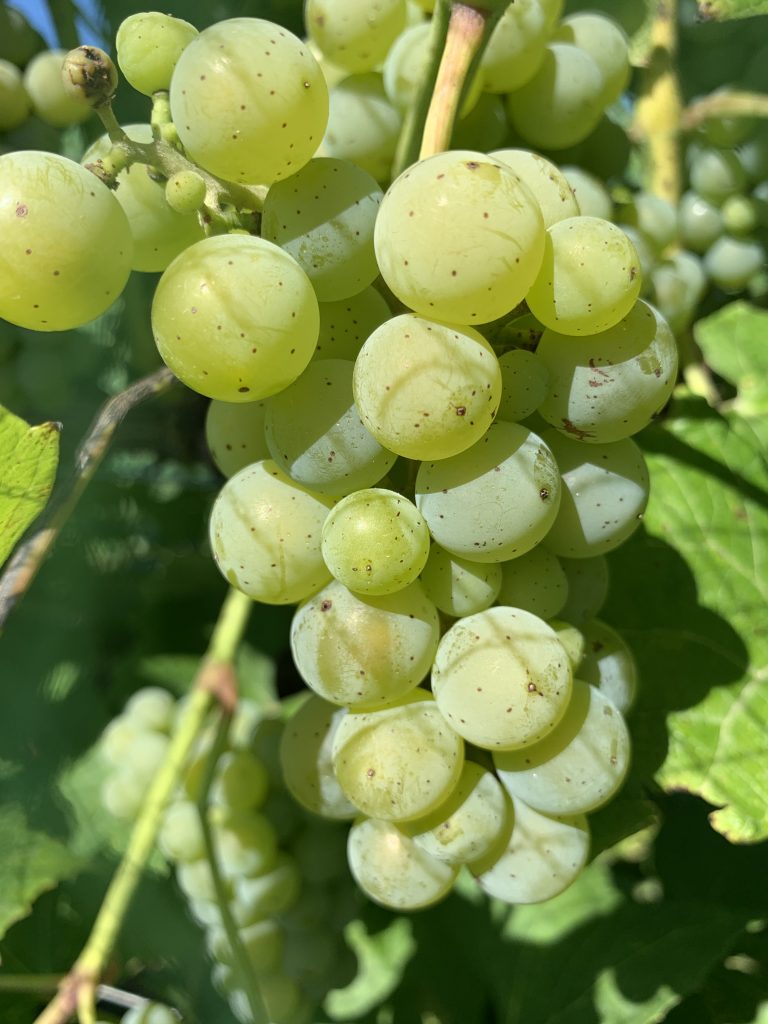
La Crescent 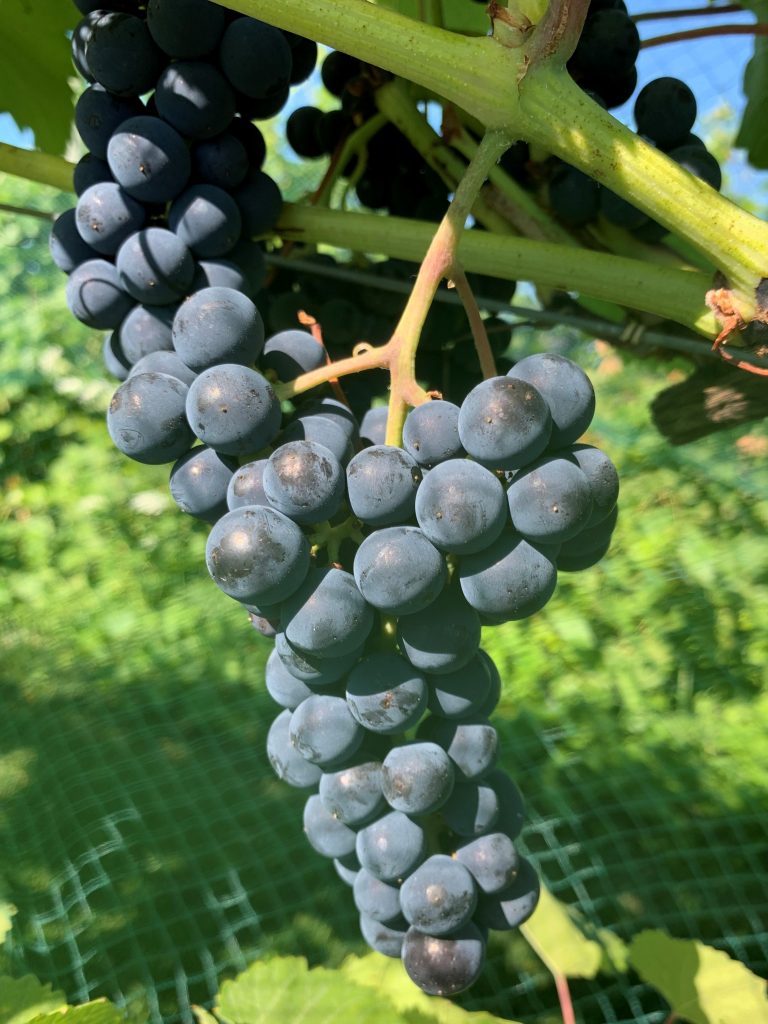
Marquette 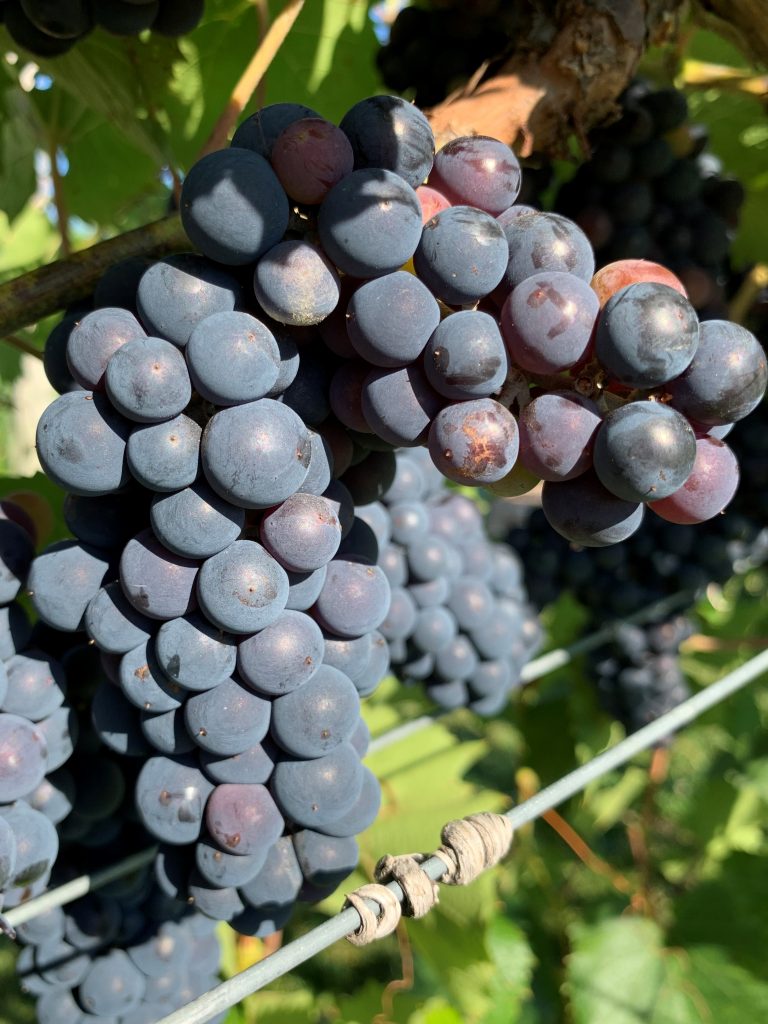
Petite Pearl
Fruit Ripening Metrics
From this newsletter until harvest, we will report the fruit ripening chemistry metrics for the cultivars at WMARS, measures that are typically used to gauge timing of harvest for cold climate grapes: total soluble solids (sugars, primarily; measured in °Brix), titratable acidity (TA, measured as tartaric acid equivalents in g/L), and pH. We measure sugars using a digital refractometer (Model HI96801, Hanna Instruments) and the TA and pH using an automatic titration system (Model HI902c, Hanna Instruments). Each value reported here is an average from pooled berry samples (about 45 berries in each, taken from both sides of the canopy) collected from panels of four vines located in two different parts of the vineyard. Crimson Pearl and Petite Pearl berry samples were collected from single vines in their respective panels because the other vines are being used for a research study.
These first values were measured on August 18 (Table 1). Itasca has the highest sugar levels (18.0 °Brix) and, along with Briana, the lowest acidity (15.5 and 15.4 g/L, respectively). Crimson Pearl and Petite Pearl both have the lowest sugars (11.7 and 11.5 °Brix) and the second highest acidity (19.6 and 19.1 g/L, respectively). By far, Frontenac has the highest acidity (25.3 g/L).
Table 1. Fruit ripening chemistry metrics of sugars, titratable acidity (TA), and pH, for cold climate grape cultivars grown at the West Madison Agricultural Research Station (WMARS). Berry samples were collected and analyzed on August 18.
| Cultivar | Sugars (°Brix) | TA (g/L) | pH |
| Brianna | 13.1 | 15.4 | 2.3 |
| Crimson Pearl | 11.7 | 19.6 | 2.8 |
| Frontenac | 13.1 | 25.3 | 2.8 |
| Itasca | 18.0 | 15.5 | 2.4 |
| La Crescent | 12.9 | 20.0 | 2.9 |
| Marquette | 14.5 | 19.1 | 2.8 |
| Petite Pearl | 11.5 | 19.2 | 2.8 |
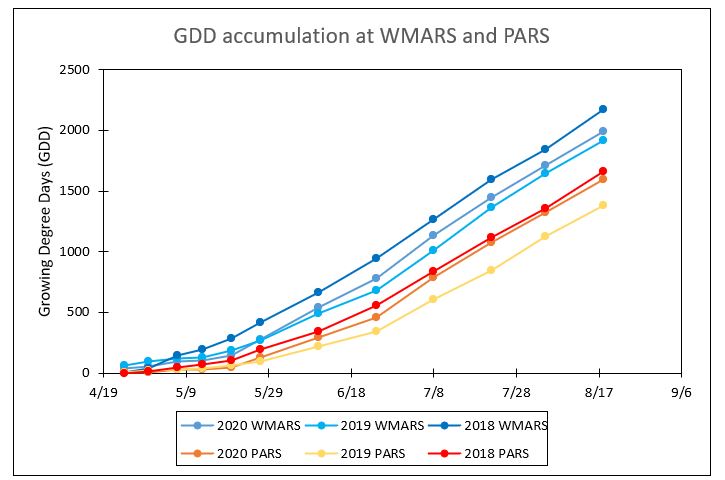
Growing Degree Day (GDD) Accumulations
Depicted in Table 2 and on the graph in Figure 1 are the GDD accumulations from April 1 through August 18 for this season and the past two seasons at the WMARS and the Peninsular Agricultural Research Station (PARS). Currently at both, the GDD accumulation for the past two weeks of the 2020 season was similar to the prior two weeks. As a result, the total heat experience at WMARS is close to that of 2019, while the temperature experience at PARS has been similar to that for 2018.
We use the NEWA website as our source for GDD data. You can visit their “About degree days” page to learn more about the concept of degree days and the formulas used in calculations.
Table 2. Growing degree day accumulation as of August 18, 2020 (April 1 biofix date; base 50 °F BE*) at the West Madison Agricultural Research Station (WMARS) and the Peninsular Agricultural Research Station (PARS).
| Location | 2020 | 2019 | 2018 |
| WMARS | 1994.4 | 1918.3 | 2174.6 |
| PARS | 1592.9 | 1385.0 | 1663.2 |