Grape Cultivar Developmental Stages: September 1, 2020
Phenology
At the West Madison Agricultural Research Station (WMARS) in Madison, WI, as of September 1, all cultivars continue to be in various stages of fruit ripening, shoot development E-L* stages 36 to 38 (“Berries with intermediate sugar values” to “Berries not quite ripe” to “Berries harvest-ripe”). We are planning to harvest Itasca and Brianna this Friday, September 4; see ripening notes below.
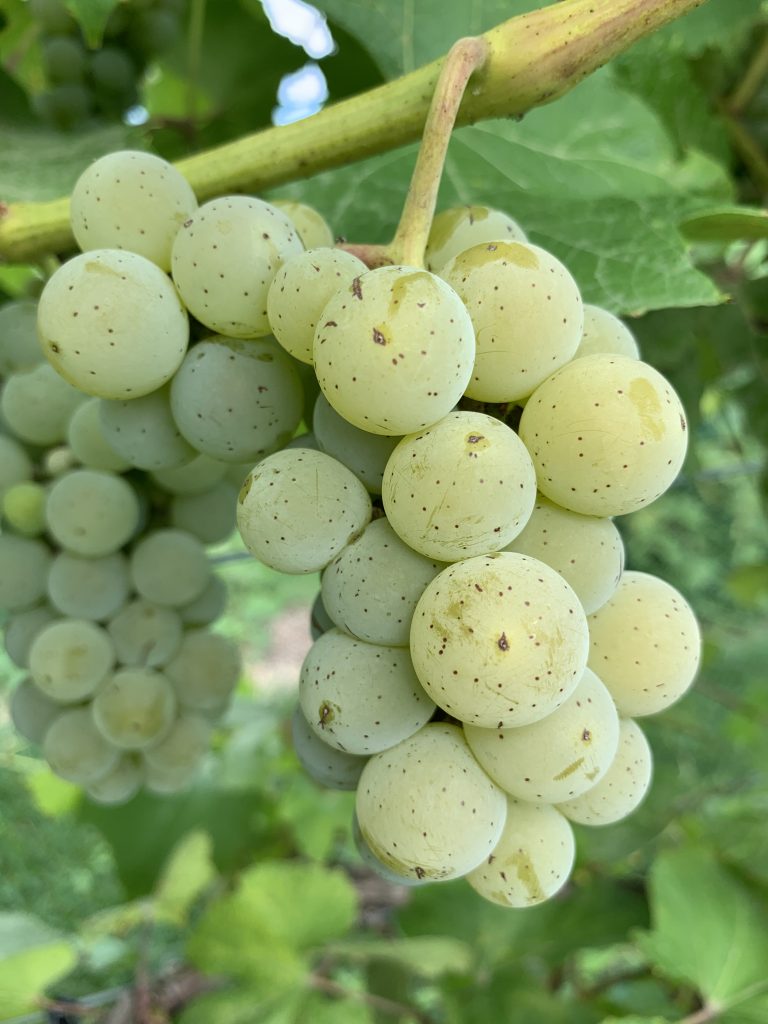
Brianna 
Crimson Pearl 
Frontenac 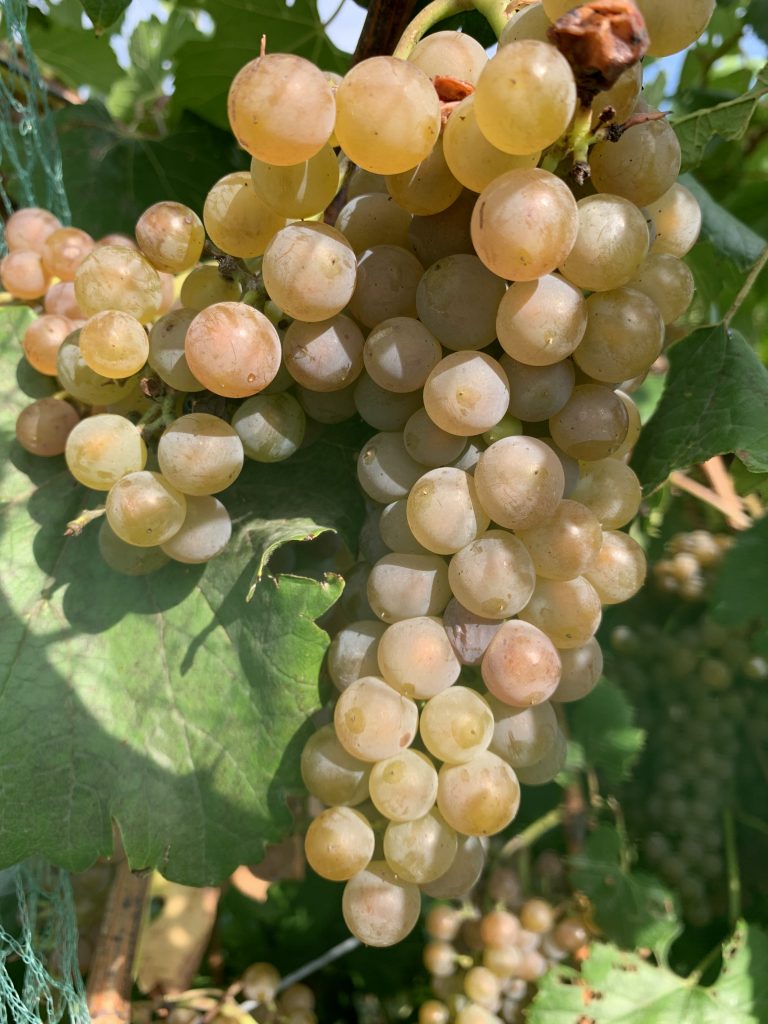
Itasca 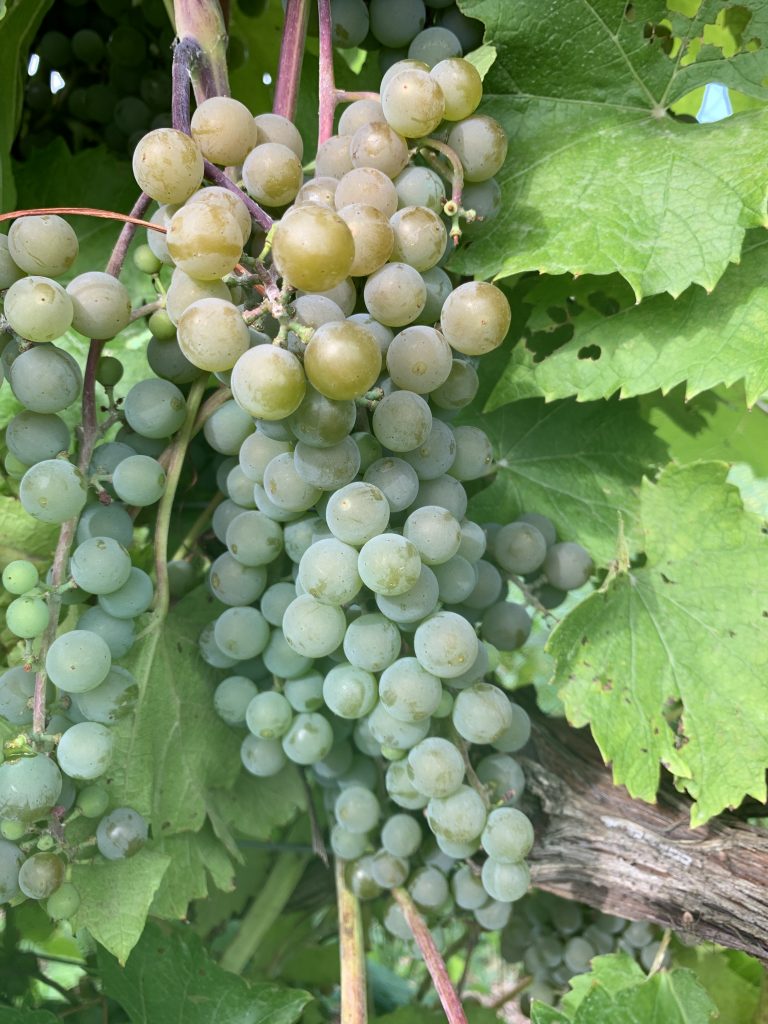
La Crescent 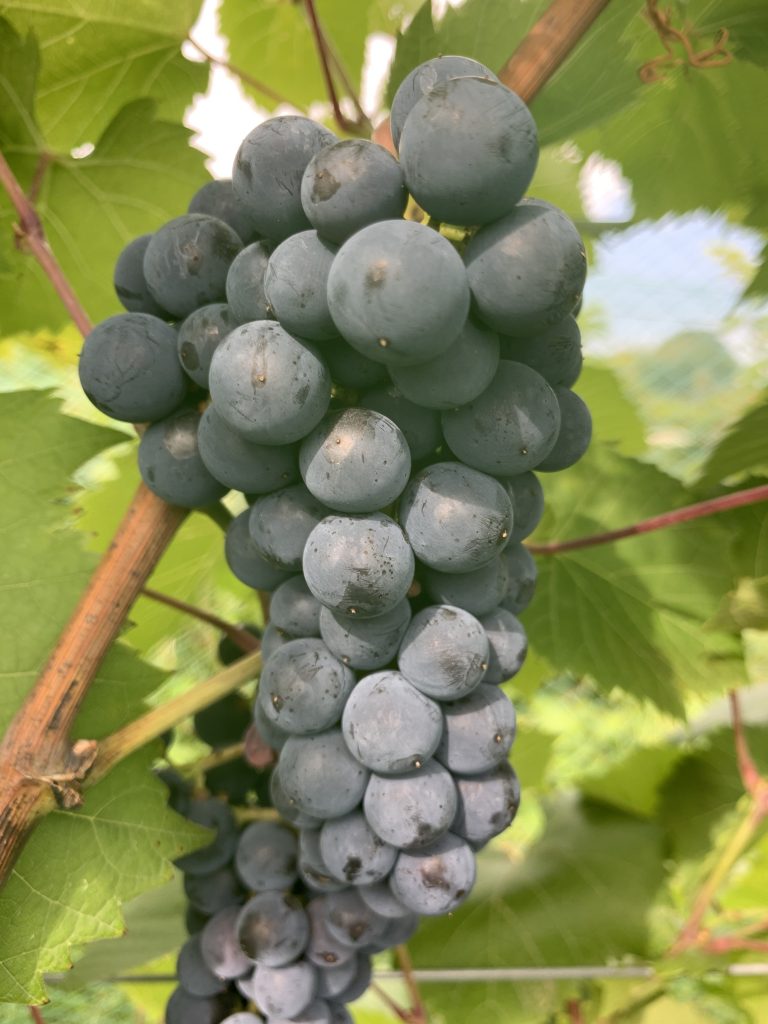
Marquette 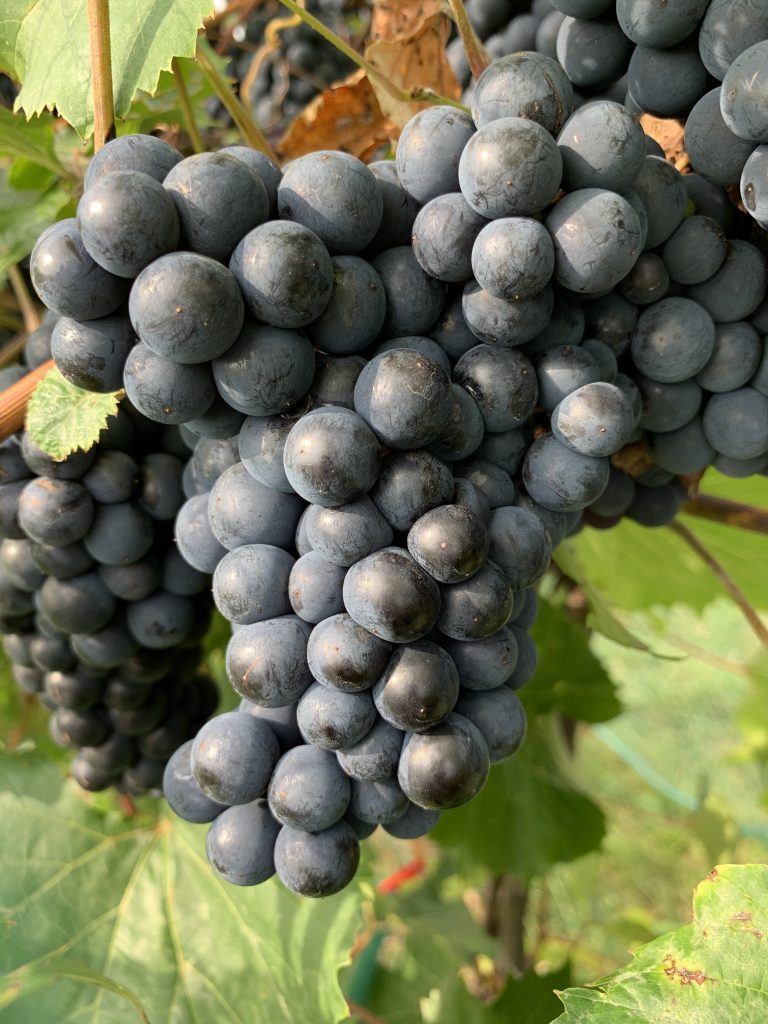
Petite Pearl
Fruit Ripening Metrics
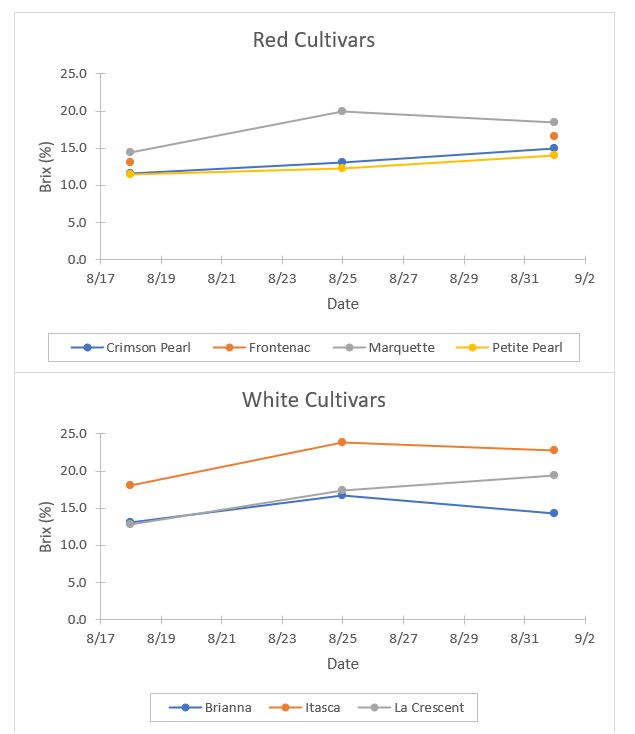
Current measurements were taken on September 1 (Table 1). Among the red cultivars, Marquette (18.4 Brix %) has the highest TSS. Of the whites, Itasca continues to have the highest TSS levels (22.8 Brix %), with La Crescent (19.5 Brix %) also nearing 20%. Brianna, Itasca, and Marquette have slightly lower values than on August 25 mostly likely due to dilution in the berries after precipitation and irrigation after an extended dry period (Figure 1). Previous samples of Marquette also included some berries that had begun dehydrating, which may also account for the higher value the previous week. Crimson Pearl and Petite Pearl both have the lowest sugars (14.9 and 14.0 Brix %, respectively) of the reds, and Briana has the lowest of the whites (14.3 Brix %).
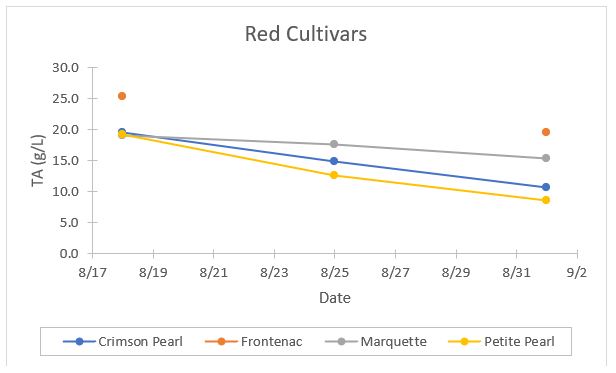
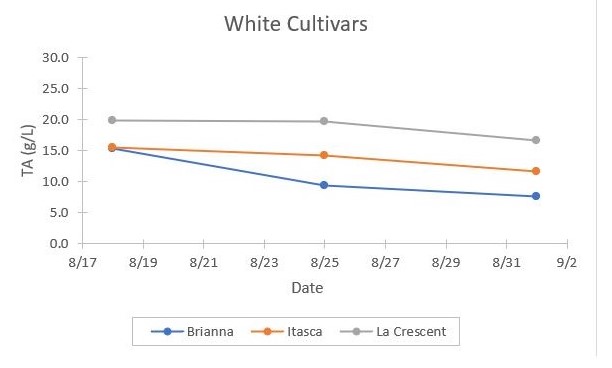
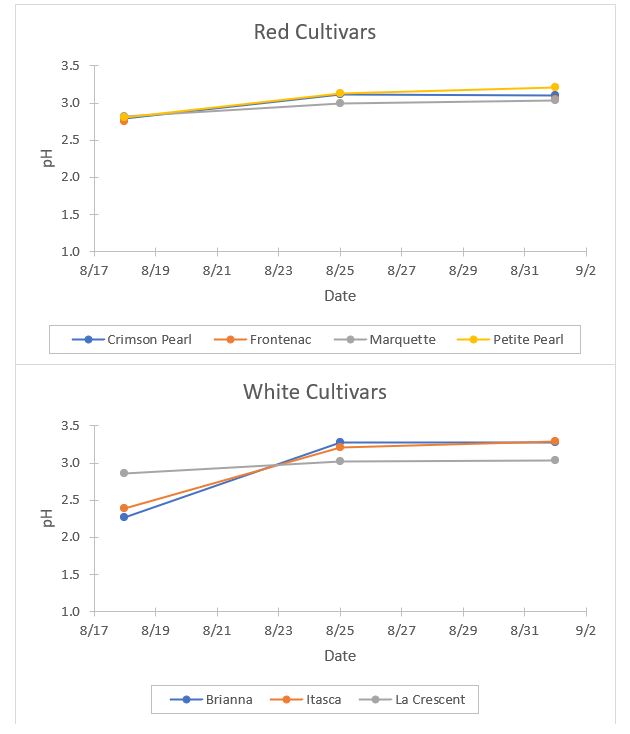
The drop in acidity levels has been driven by the recent extended period of hot weather in the southern portion of the state; this is primarily the result of the breakdown of malic acid. For the red cultivars, Crimson Pearl and Petite Pearl acidity levels are currently near 10 g/L, while Briana has the lowest acidity (7.6 g/L) for the whites (Figure 2). Among all the cultivars, pH ranges from 3.0 to 3.3, and have risen over the last two weeks, except for La Crescent, which was already at 2.9 at the first measurement date (Figure 3).
Table 1. Fruit ripening chemistry metrics of sugars, titratable acidity (TA), and pH, for cold climate grape cultivars grown at the West Madison Agricultural Research Station (WMARS). Current berry samples were collected and analyzed on September 1.
| Cultivar | Brix (%) | TA (g/L) | pH |
| Brianna | 14.3 | 7.6 | 3.3 |
| Crimson Pearl | 14.9 | 10.7 | 3.1 |
| Frontenac | 16.6 | 19.5 | 3.1 |
| Itasca | 22.8 | 11.7 | 3.3 |
| La Crescent | 19.5 | 16.7 | 3.0 |
| Marquette | 18.4 | 15.4 | 3.0 |
| Petite Pearl | 14.0 | 8.5 | 3.2 |
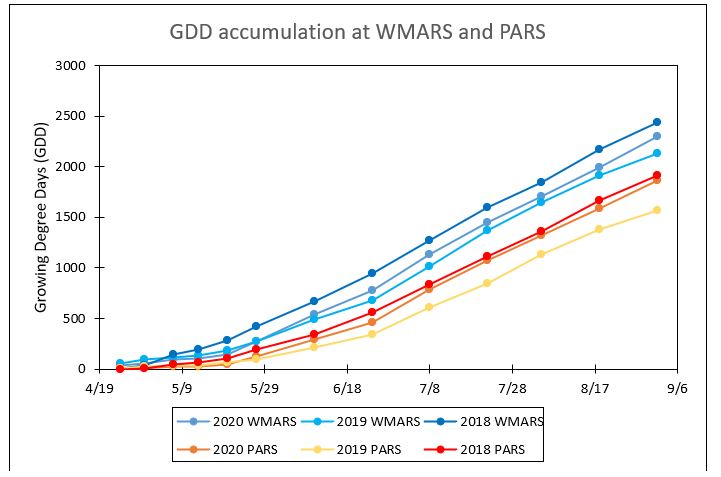
Growing Degree Day (GDD) Accumulations
Depicted in Table 2 and on the graph in Figure 4 are the GDD accumulations from April 1 through September 1 for this season and the past two seasons at the WMARS and the Peninsular Agricultural Research Station (PARS). Currently at both, the GDD accumulation for the past two weeks of the 2020 season was greater than over the prior two weeks. As a result, the total 2020 heat experience at WMARS continues to approach that of 2019, while the temperature experience at PARS has been similar to that for 2018 for much of this season.
We use the NEWA website as our source for GDD data. You can visit their “About degree days” page to learn more about the concept of degree days and the formulas used in calculations.
Table 2. Growing degree day accumulation as of September 1, 2020 (April 1 biofix date; base 50 °F BE*) at the West Madison Agricultural Research Station (WMARS) and the Peninsular Agricultural Research Station (PARS).
| Location | 2020 | 2019 | 2018 |
| WMARS | 2299.6 | 2131.6 | 2439.9 |
| PARS | 1867.4 | 1566.5 | 1910.2 |
*BE = Baskerville-Emin calculation method