Cold Climate Grape Cultivar Developmental Stages August 18, 2021
Phenology
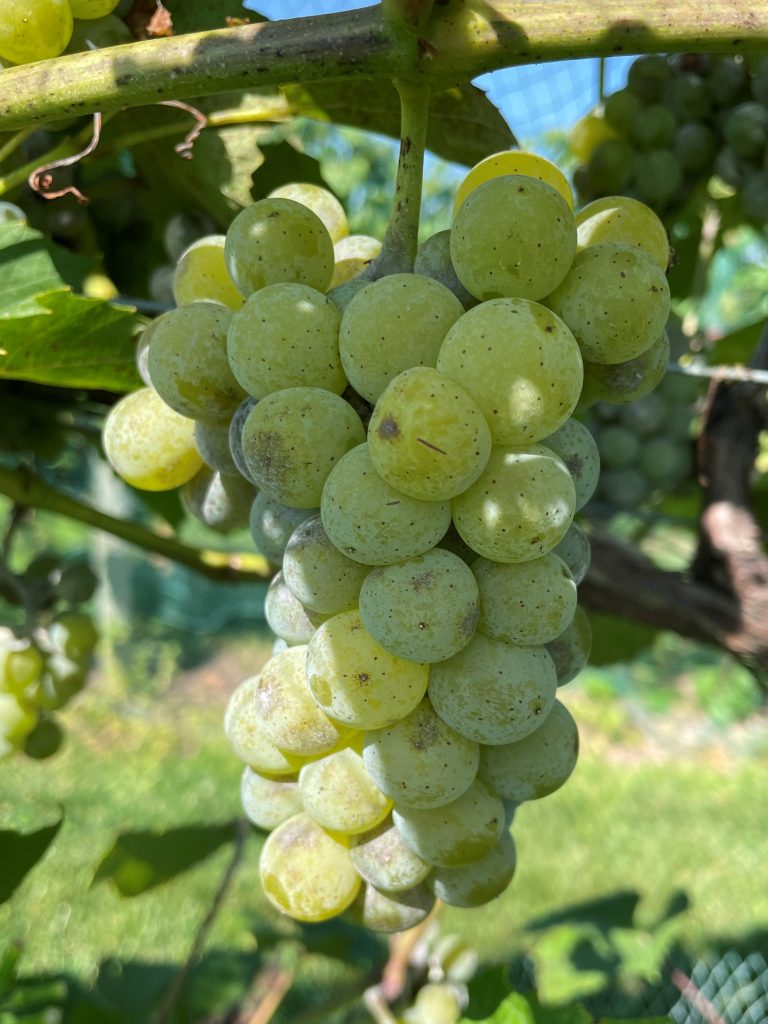
The berries of all cultivars at West Madison Research Station (WMARS) are ripening and have either intermediate TSS/sugar values (E-L* Stage 36) or are not quite ripe (E-L* Stage 37). See Table 1 for the dates veraison (beginning of berry color change) was reached, and we will add harvest dates as they occur for each cultivar.
*E-L stands for the Eichhorn-Lorenz growth stages scale to describe grapevine development.
Brianna 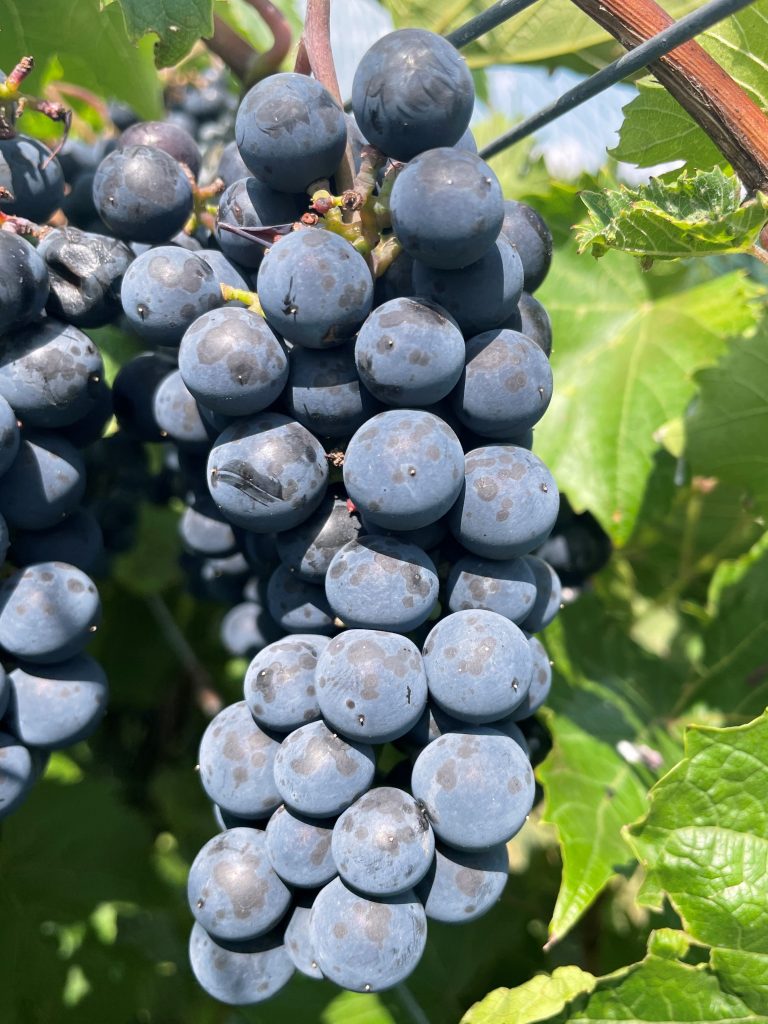
Crimson Pearl 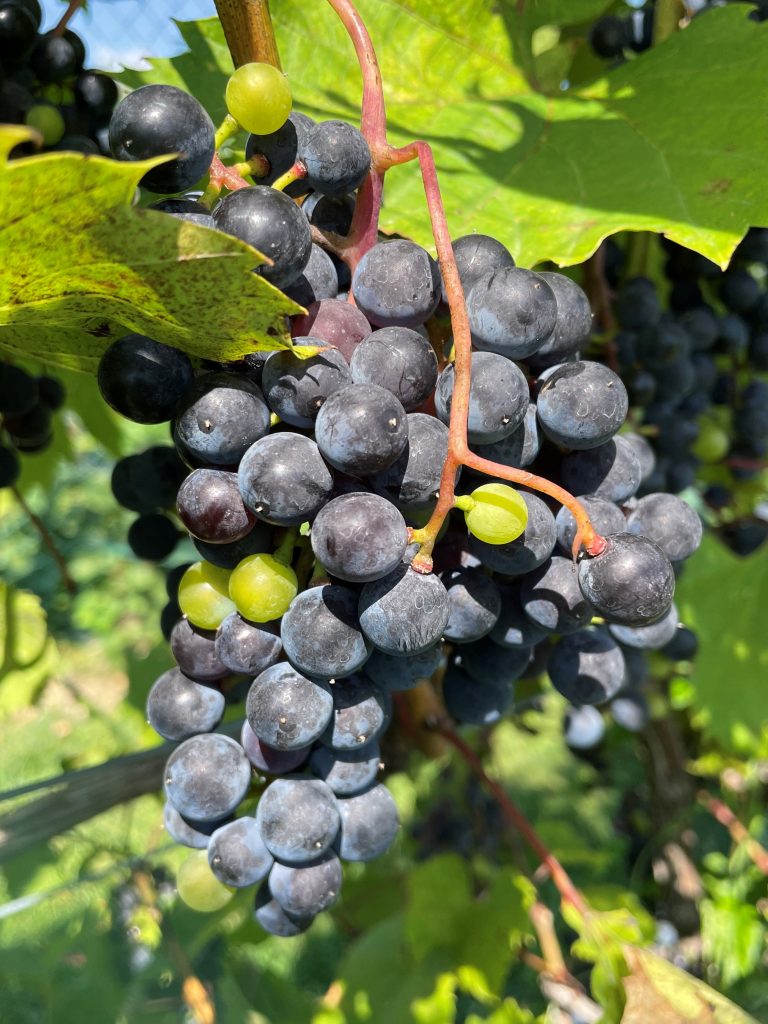
Frontenac 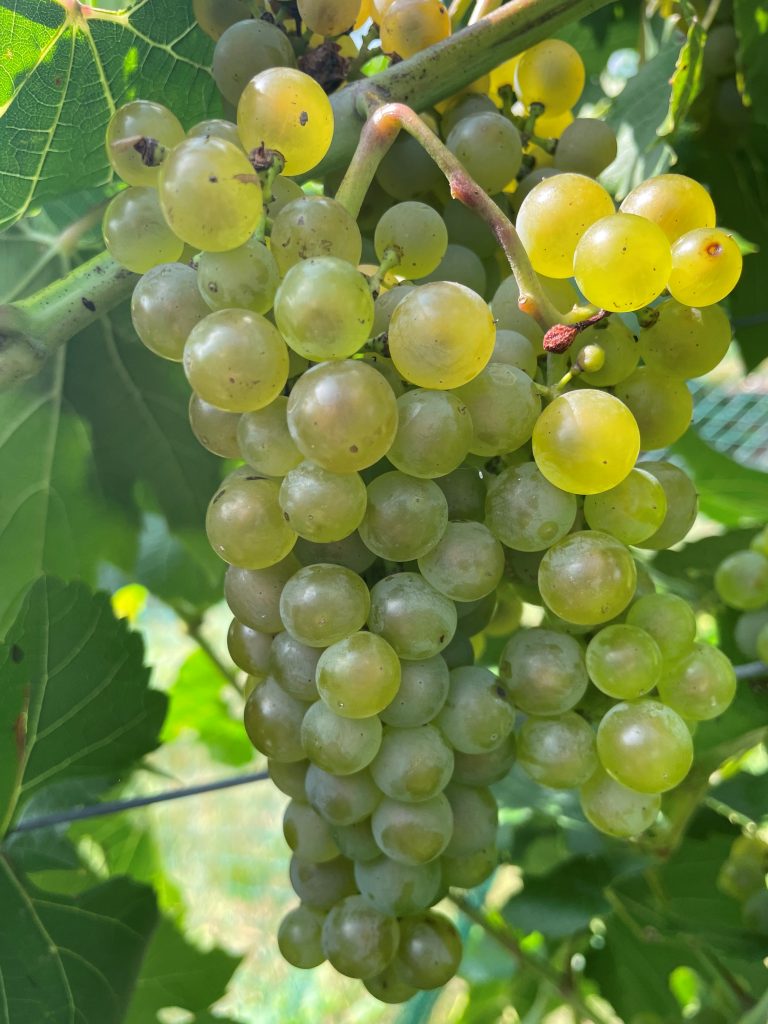
Itasca 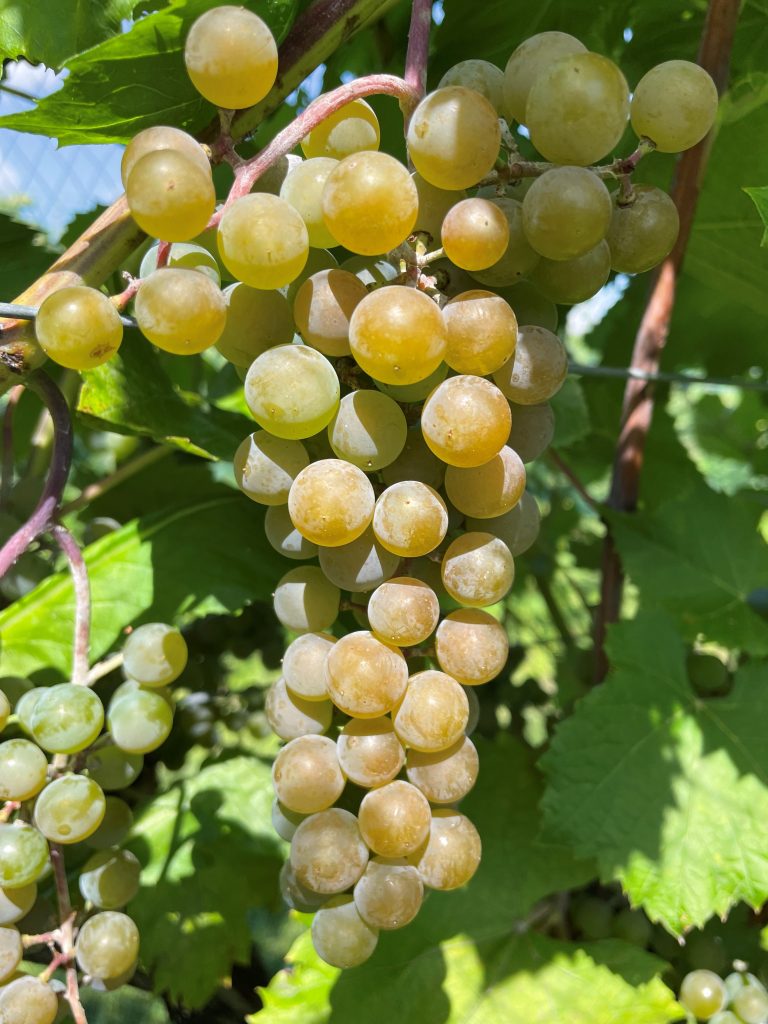
La Crescent 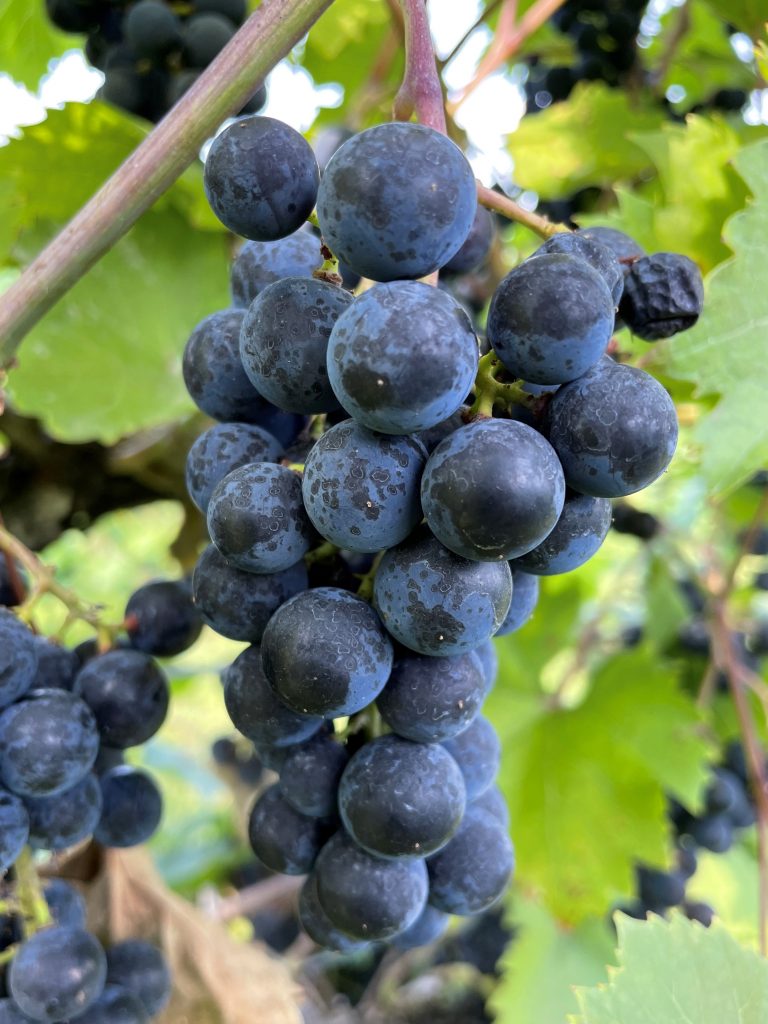
Marquette 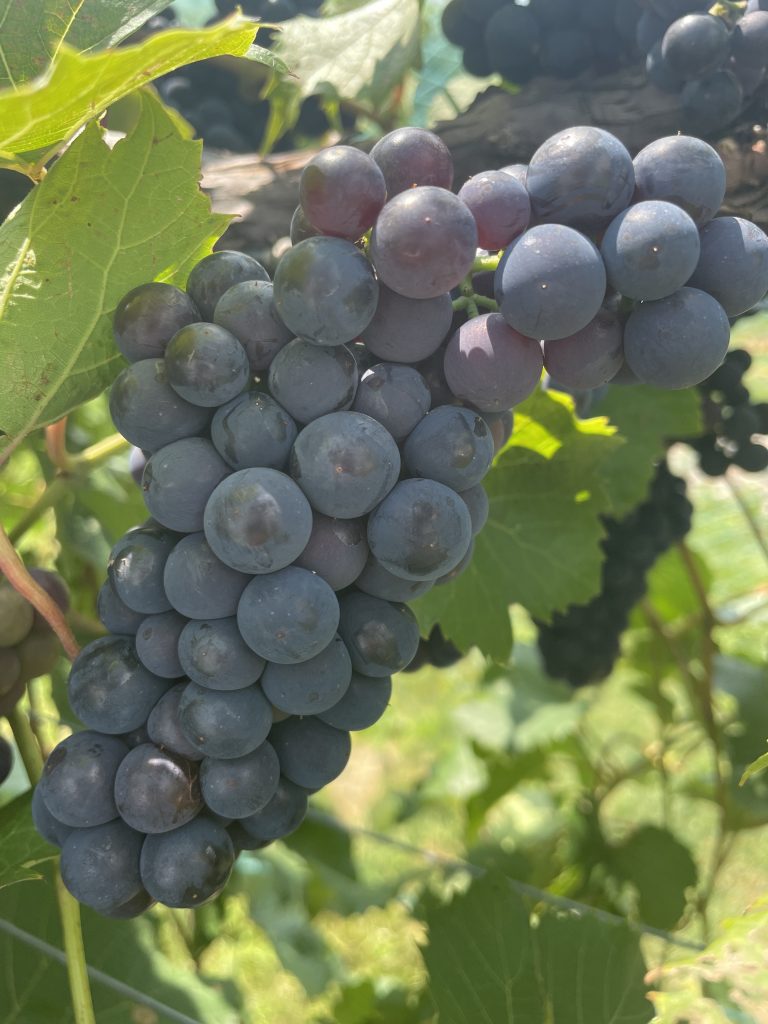
Petite Pearl
Figure 1. Ripening clusters of grape cultivars at the West Madison Agricultural Research Station, as of August 4.
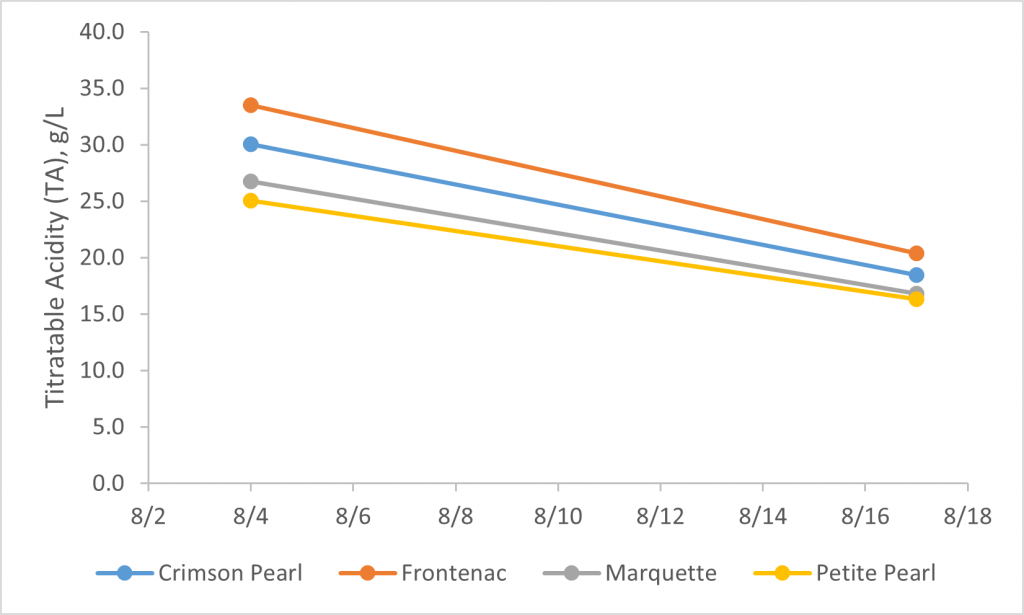
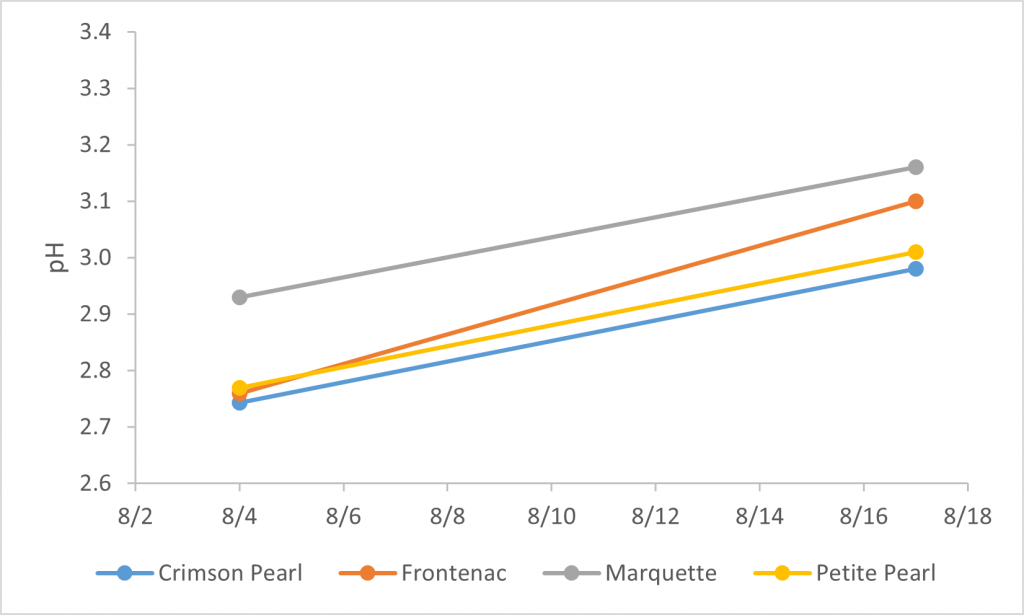
Berry Ripening Parameters
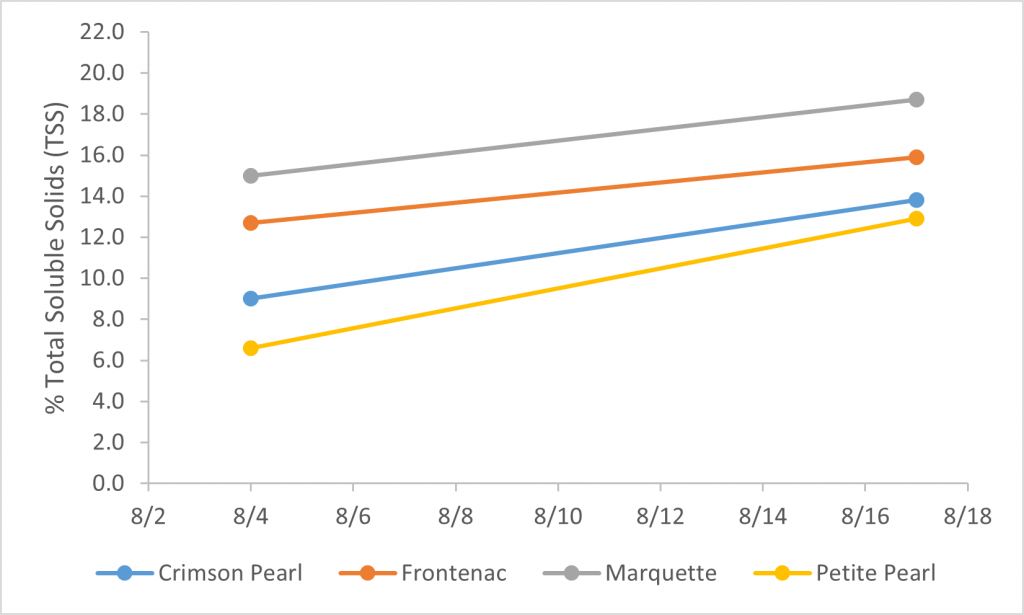
Below are graphs showing the progression of the berry ripening parameters at WMARS: % total soluble solids (TSS), titratable acidity (TA) concentrations, and pH. All cultivars reported here are grown on the high cordon training system.
TSS is a measure of the density (mass/volume) of all the soluble solids in grape berry juice and is determined easily using a refractometer as %TSS. Sugars (mainly glucose and fructose) comprise 95-99% of the TSS in grape juice and so %TSS is good stand-in measure for sugars. It is common for people to use %TSS and °Brix interchangeably when referring to sugar levels in fruit. Other constituents of TSS include organic acids, phenolic compounds, nitrogenous compounds, and structural polysaccharides. Hydrometers utilize various scales, including ºBrix, and measure the sucrose (a disaccharide composed of one unit of glucose and one unit of fructose) concentration in aqueous solution (1 ºBrix = 1 g sucrose / 100 g solution = 1%).
The concentration and strength of acids in grapes is accounted for in two ways: TA and pH. TA measures both the dissociated (free hydrogen ions) and un-dissociated acids (such as in organic acids). The main organic acids in grapes are tartaric and malic acids, with citric acid a distant third. TA is measured by titration of the sample with a base (an alkaline solution), such as sodium hydroxide, and is expressed as a concentration (g/L) on the basis of tartaric acid equivalents. The values determined are a good indication of the sensory perception of tartness. The pH of substance is a measurement of the concentration of dissociated free hydrogen ions, expressed on a unitless scale from 1 (acidic) to 14 (basic).
Red
White
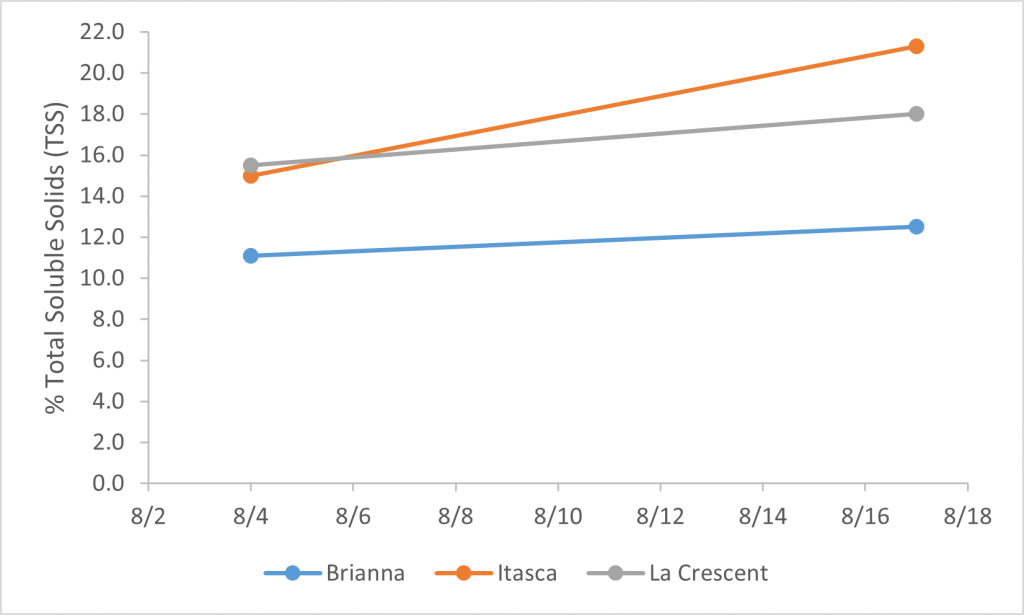
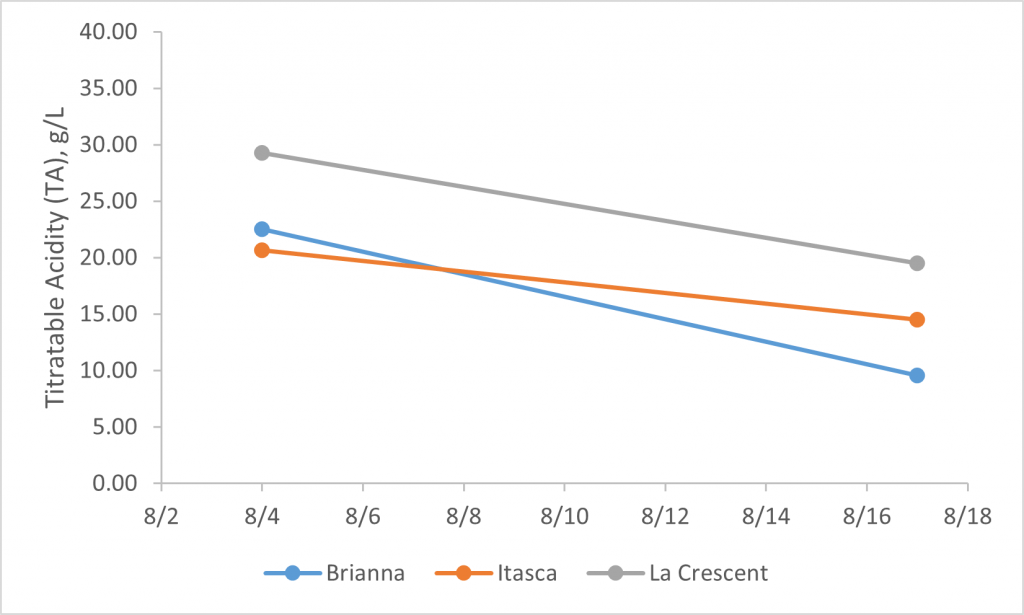
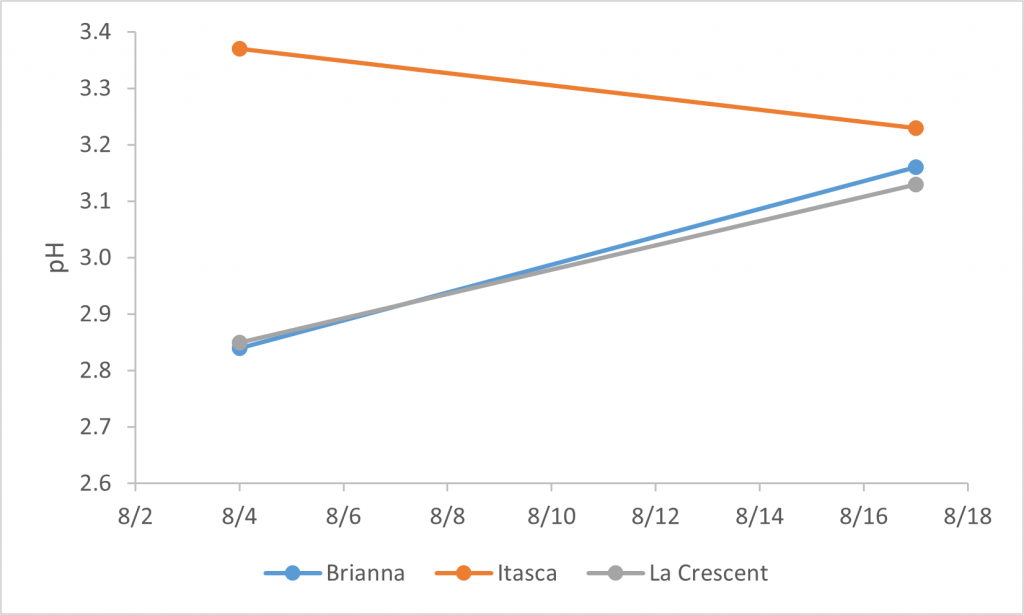
Table 1. Dates for veraison reached and harvest of the cold climate interspecific hybrid grape cultivars at the West Madison Agricultural Research Station.
| Wine color | Cultivar | Date reached Veraison at WMARS | Harvest date |
| Red | Crimson Pearl | 7/27 | |
| Frontenac | 7/27 | ||
| Marquette | 7/24 | ||
| Petite Pearl | 8/1 | ||
| White | Brianna | 7/30 | |
| Itasca | 7/20 | ||
| La Crescent | 7/30 |
Growing Degree-Day (GDD) Accumulations
Depicted in Figure 3 and listed in Table 2 are the GDD accumulations from April 1 to August 17 for this year and the past two seasons at WMARS and the Peninsular Agricultural Research Station (PARS). Degree-days were calculated using a base 50 °F, starting on April 1 as a biofix date. We use the NEWA website and the “BE” (Baskerville-Emin) calculation. This method uses a sine wave instead of a simple average temperature calculation, which is thought to provide a more accurate estimation of degree-days. You can visit the NEWA “About degree days” page to learn more about the concept of degree days and the formulas used in calculations. (http://newa.cornell.edu/index.php?page=about-degree-days).
Rates of GDD accumulation at both WMARS and PARS continue on the same trajectory as reported two weeks ago, with the current season having the greatest, 2020 the next greatest and 2019 the lowest. The differences between each of the years’ totals is similar to that of up to four weeks ago. At PARS, the current and 2020 season accumulations are nearly the same, while the 2019 season in mid August is the coolest of any year or location.
Table 2. Growing degree day accumulation as of August 17, 2021 (April 1 biofix date; base 50 °F BE*) at the West Madison Agricultural Research Station (WMARS) and the Peninsular Agricultural Research Station (PARS).
| Location | 2021 | 2020 | 2019 |
| WMARS | 2120 | 1978 | 1899 |
| PARS | 1629 | 1580 | 1365 |
*BE = Baskerville-Emin calculation method
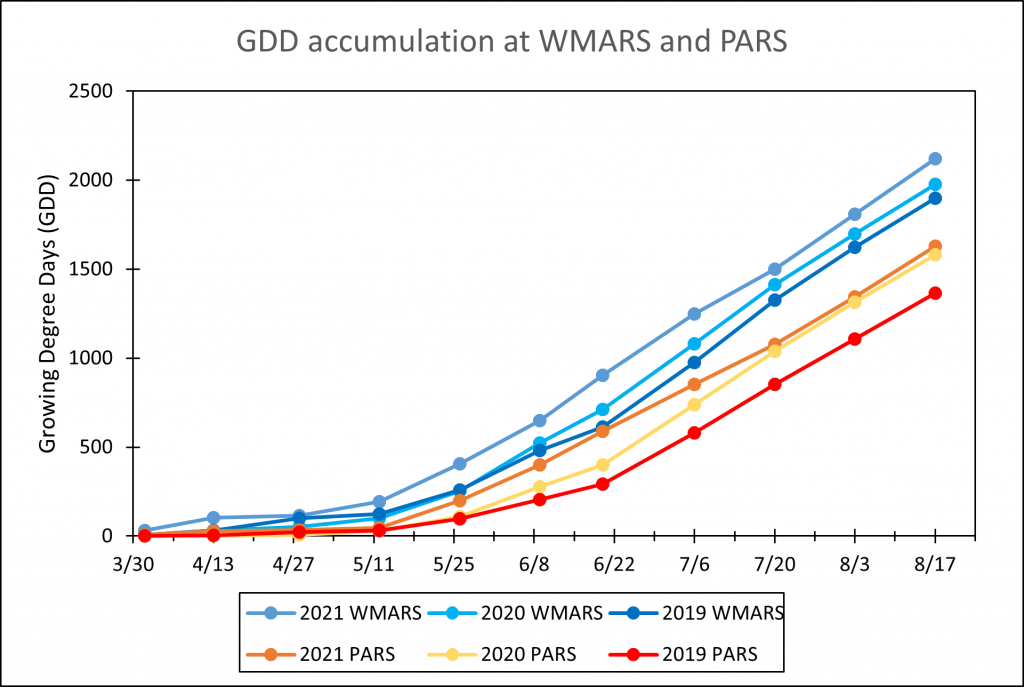
Figure 3. Accumulation of growing degree days (GDD) as of August 17 (April 1 biofix date) at both the West Madison Agricultural Research Station (WMARS) and the Peninsular Agricultural Research Station (PARS) for 2019, 2020 and 2021.
This article was posted in Grapes and tagged Amaya Atucha, Beth Ann Workmaster, grape phenology, Grapes, grapes developmental stages, Jarret Miles-Kroening.